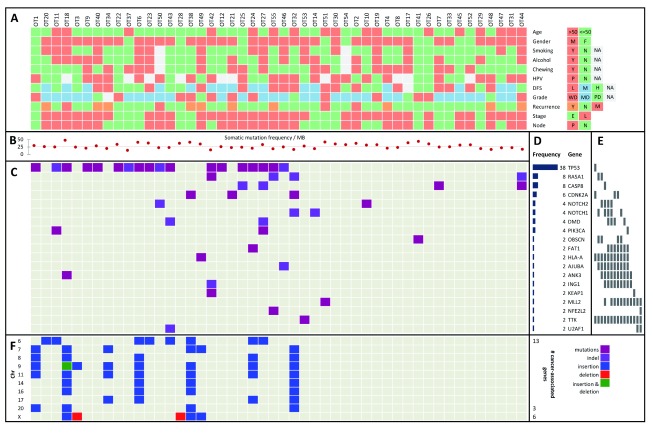
Figure 1. Key variants in OTSCC and their relationship with habits, clinical and epidemiological parameters.
A. The OTSCC samples are represented in color-codes with their corresponding status on; node (P: positive, N: negative); stage (E: early, L: late), recurrence (Y: loco-regionally recurrent, N: non-recurrent and M: distant metastatic); grade (WD: well-differentiated, MD: moderately-differentiated and PD: poorly-differentiated); disease-free survival or DFS (L: low/≤12mo, M: mid/12–24mo and H: high/>24mo); HPV (P: positive and N: negative); and habits (chewing, alcohol and smoking, Y: yes and N: no). B. Somatic mutation frequency per megabase (MB) is represented as scatterplot with the median point as a fine dotted line. C. Genes with significant somatic variants. D. Frequency histogram of nineteen cancer-associated genes bearing somatic missense and nonsense variants (mutations and indels). E. Columns representing mutually exclusive sets of genes. F. Significant copy number insertions and deletions (CNVs), alongside the chromosome cytobands (the numbers of cancer-associated genes within each cytoband are listed on the right).

