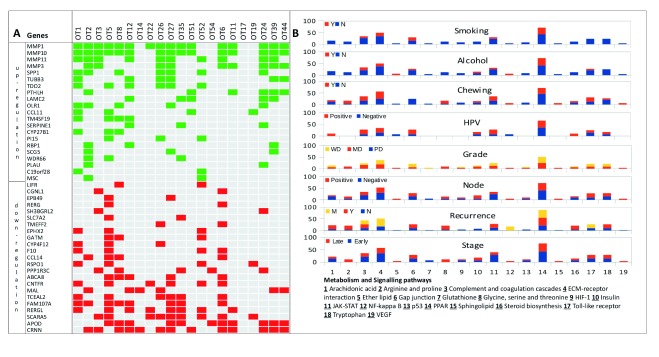
Figure 3. Differentially expressed genes, affected pathways and their relationship with clinical and epidemiological parameters.
A. Expression changes (green – up- and red – down-regulation) representing significantly differentially expressed genes in tumors. B. Stacked histograms representing relative patient fraction (%) for each of the 19 cancer-associated pathways and their relationship with clinical and epidemiological parameters.

