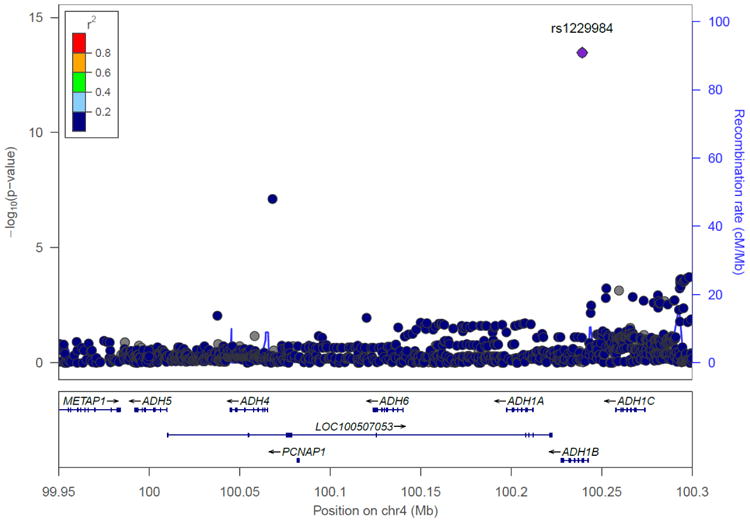
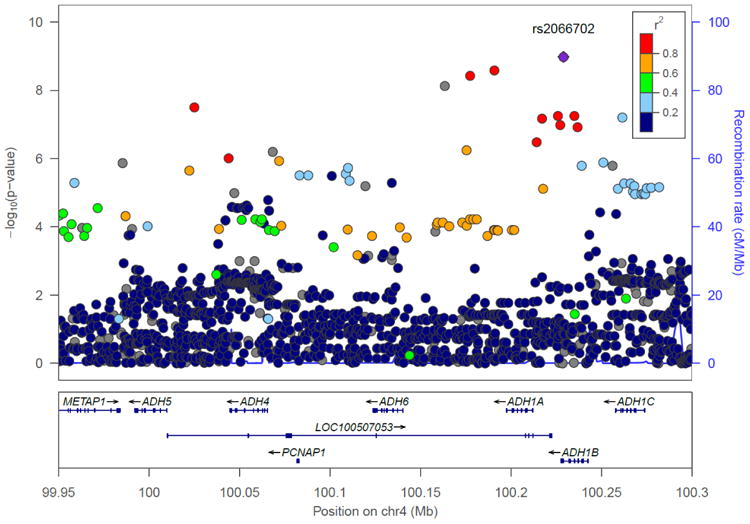
Figure 3.


Chromosome 4 regional Manhattan plots in the combination of the Yale-UPenn samples and the SAGE samples. Left: European Americans: The peak significant SNP was rs1229984 on ADH1B (p=5.96 x 10⁻¹⁵) Right: African Americans: The peak significant SNP was rs2066702 on ADH1B (p=2.50 x 10⁻¹⁰)
