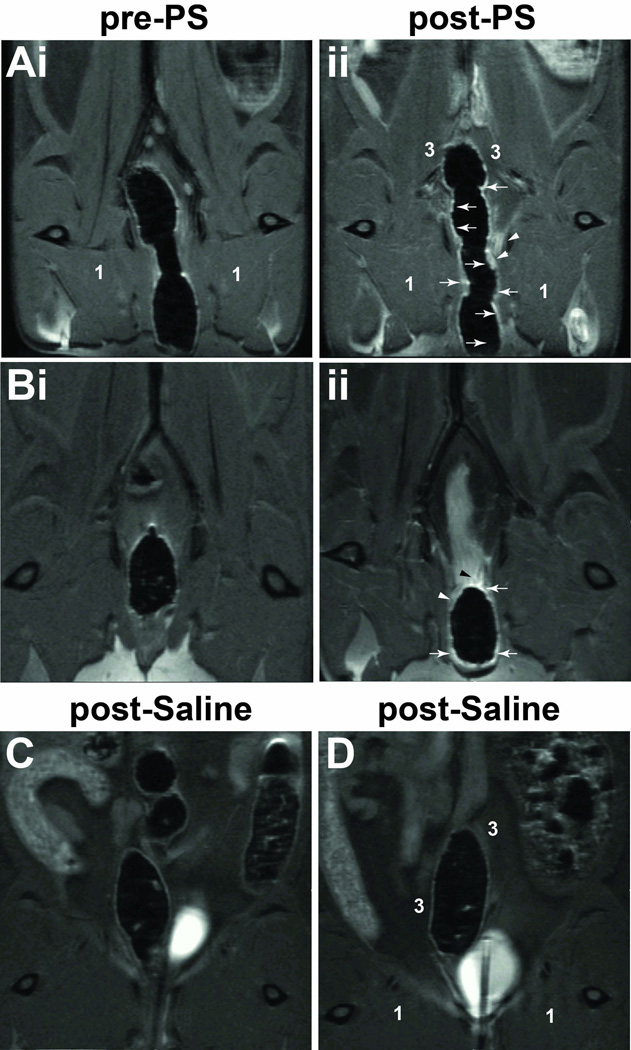
Figure 3.
CE-MRI visualization of increased contrast-related signal intensity in the colon following exposure of the bladder to PS. (A,B) Pre-PS bladder exposure CE images (i). (ii) Post-contrast images obtained 24 h post-PS bladder exposure. Increased Gd-DTPA contrast in colon mucosa (white arrows) and surrounding tissue (white arrow heads) is observed. (C,D) Contrast images 24 h post-saline administration (shams). Medial thigh muscle (1) and tissues surrounding the colon (3).

