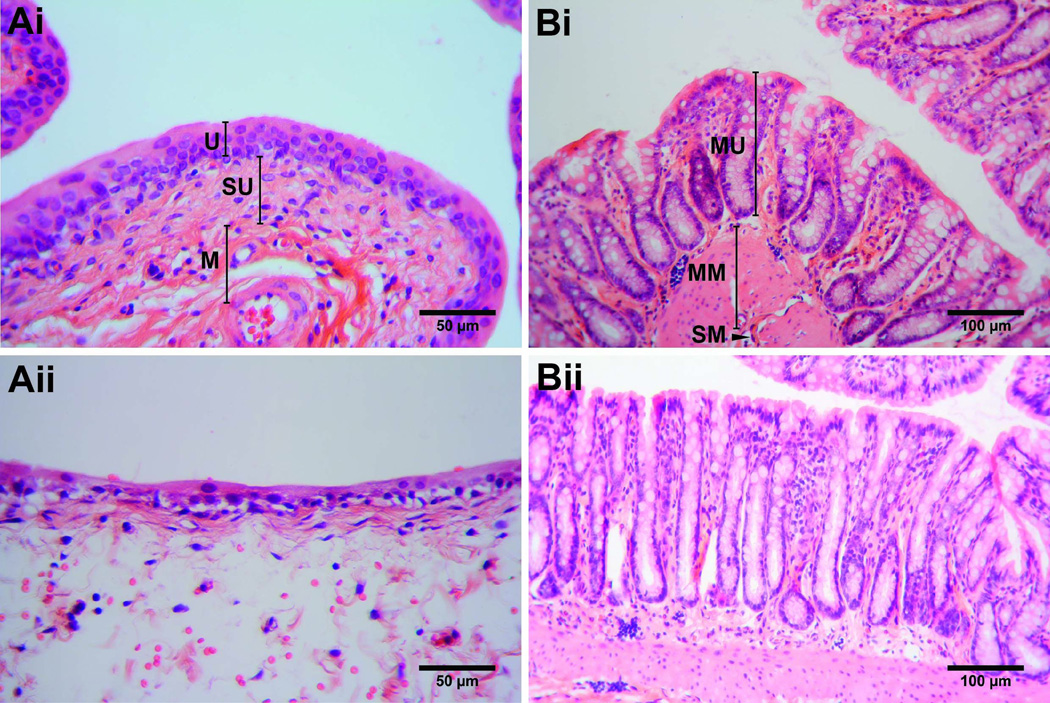
Figure 5.
Histology slides of rat bladders (A) either saline-treated (i) or PS-treated (24 h post treatment) (ii), and the colon (B) either saline-treated (i) or from animals with bladders exposed to PS (24 h post-treatment) (ii). Control bladder tissue obtained from a saline-treated mouse (40× magnification, 50 µm scale bar). Labels: Urothelium (U), Suburothelium (SU), and Muscle layer (M). Example of PS-treated bladder shown with localized edema in the suburothelium, and intracellular edema in the urothelium (40× magnification, 50 µm scale bar). Control colon tissue obtained from animal treated with saline in the bladder (20× magnification, 100 µm scale bar). Labels: Mucosa (MU), Muscularis mucosae (MM), and Submucosa (SM). Example of colon region of PS-treated bladder shown (20× magnification, 100 µm scale bar).

