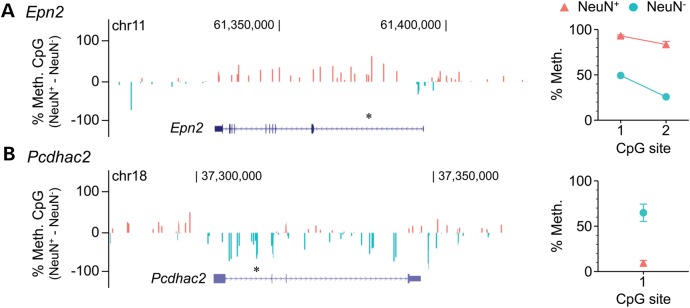
Figure 4.
At genes with discrepant cell type-specific methylation calls between the two analyses, quantitative bisulfite pyrosequencing validates our analysis. (A) Epn2, classified by Lister et al. as showing ‘intragenic mCG and mCH hypomethylation in neurons but not glia’ is actually hypermethylated in neurons relative to glia, according to both their raw Bisulfite-seq data (left) and our bisulfite pyrosequencing (right). (B) Pcdhac, classified by Lister et al. as showing ‘neuronal mCG and mCH hypermethylation, and glial mCG and mCH hypomethylation’ is actually hypermethylated in glia relative to neurons, according to both their raw Bisulfite-seq data (left) and our bisulfite pyrosequencing (right). Asterisks above gene diagrams indicate genomic regions covered by pyrosequencing. Pyrosequencing data represent the mean ± SEM of 6–7 samples per cell type.

