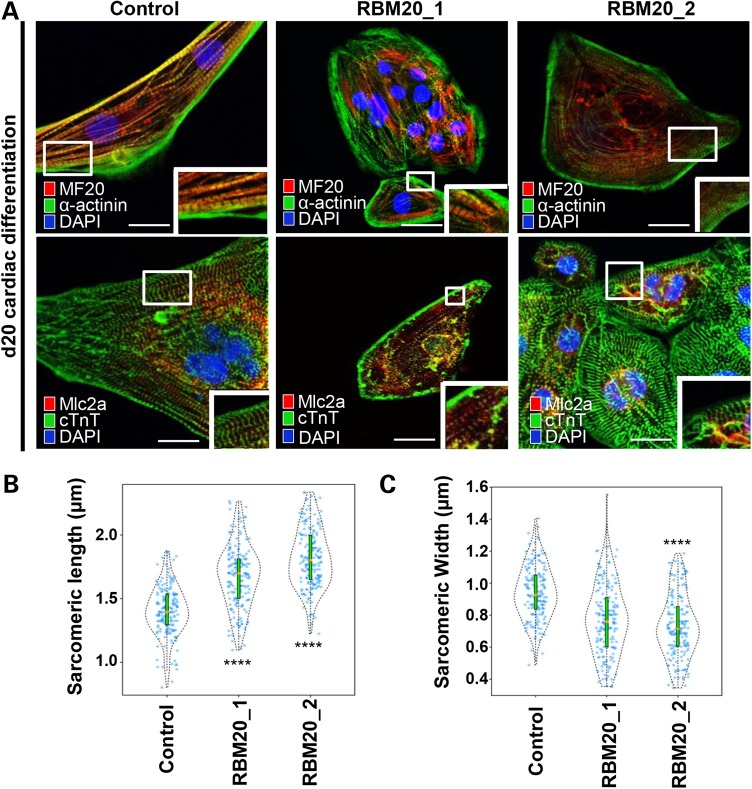
Figure 4.
RBM20 familial DCM hiPSC-CMs display abnormal sarcomere geometry. (A) Immunostainings of RBM20 hiPSCs-derived single-cell CMs for MF20, α-actinin, MLC2A and cTnT at Day 20. Note variable expression levels of cardiac-specific markers in control versus RBM20 DCM-hiPSCs-CMs (MF20 = Myosin II heavy chain; MLC2A = Myosin light chain 2A; cTnT = cardiac troponin T). Abnormal sarcomere geometry present in RBM20-deficient hiPSCs-CMs. Scale bars: 20 µm. (B) and (C) Violin plots show difference in sarcomere geometry of control versus RBM20 DCM hiPSCs-CMs. Orange dot = median of sarcomeric length and width (****P < 0.0001, n = 175). Scale bars: 0.5 µm.

