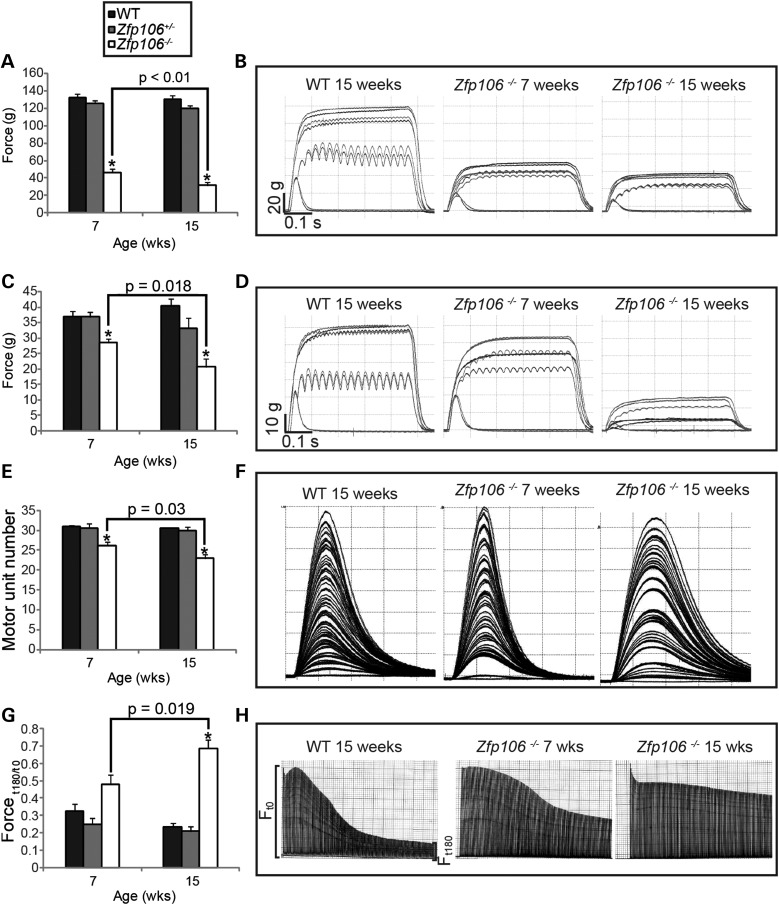
Figure 2.
Assessment of hind limb muscle force, motor unit survival and muscle fatigue on female mice. (A and B) Summary of the maximum tetanic muscle force generated from the TA muscle. (A) TA tetanic muscle force generated by Zfp106−/− mice at 7-weeks of age (47 g ± 4 g) is reduced compared with WT littermates (133 g ± 4 g). TA tetanic tension is further reduced in 15-week-old Zfp106−/− mice (32 g ± 4 g) compared with 7-week-old Zfp106−/− mice. (B) Representative traces of TA tetanic tension from WT and Zfp106−/− mice at 7- and 15-weeks of age. (C and D) Tetanic muscle force generated from the EDL at 7- and 15-weeks of age (see ‘Materials and Methods’). (C) EDL tetanic muscle force generated by Zfp106−/− mice at 7-weeks (29 g ± 1 g) is reduced compared with WT littermates (37 g ± 2 g) and becomes further reduced in 15-week-old Zfp106−/− mice (21 g ± 3 g). (D) Representative traces of EDL tetanic tension from WT, 7- and 15-week old Zfp106−/− mice. (E and F) The number of surviving motor units in the EDL muscle of female mice at 7- and 15-weeks of age; motor units are reduced in 7-week-old Zfp106−/− mice (26 ± 0.9) compared with WT littermates (31 ± 0.4), and are further reduced in 15-week-old Zfp106−/− mice (23 ± 1). (F) Representative motor unit traces from EDL muscles of WT, 7- and 15-week old Zfp106−/− mice. Each twitch trace recording is a single motor unit. (G and H) FI (see ‘Materials and Methods’ section) of EDL muscle for female mice at 7 and 15-weeks of age. FI of 7-week old Zfp106−/− mice (0.48 ± 0.05) is increased compared with WT littermates (0.32 ± 0.04) but not significantly (P = 0.07). FI increases further in 15-week-old Zfp106−/− mice (0.69 ± 0.05) compared with 7-week old Zfp106−/− mice. (H) Representative fatigue traces from WT, 7- and 15-week Zfp106−/− mice, produced by repetitive stimulation of the EDL muscle for 180 s. Each line in the trace represents a single tetanic tension. Results are presented as the mean ± SEM. At least 10 legs were assessed per genotype per time point. *P ≤ 0.001, or indicated within each chart when comparing Zfp106−/− mice from 7- and 15-weeks of age.

