Figure 5.
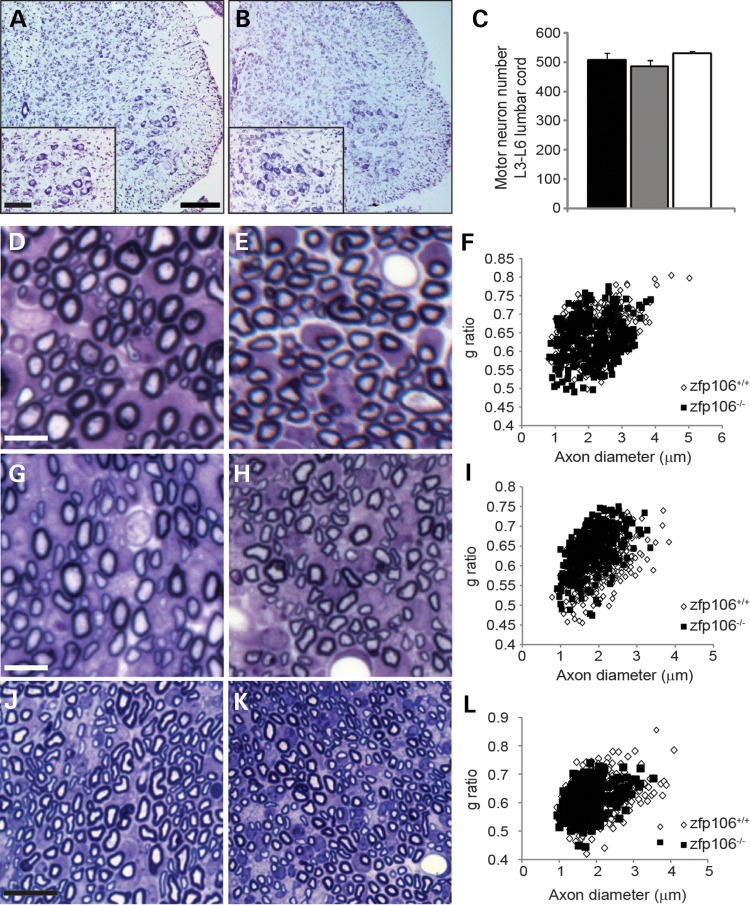
Neuronal survival and axonal morphology at P9. (A and B) Representative images of the ventral horn of lumbar spinal cord sections stained for Nissl from P9 WT and Zfp106−/− mice. The number of motor neurons in the sciatic pool (inset) was counted for each genotype. Scale bars: main images 200 μm, inset 100 μm. (C) Survival of motor neurons in the sciatic pool in female mice at P9. Motor neuron survival is unaffected in P9 Zfp106−/− mice (530 ± 15) compared with WT littermates (508 ± 23). Numbers represent the mean ± SEM. At least five animals were assessed per genotype per time point. (D and E) Representative toluidine blue stained sections of lumbar L4 and L5 ventral roots from P9 WT (D) and Zfp106−/− (E) mice. (F) Distribution graph relating g-ratio to axon diameter of all myelinated axons analysed from ventral roots show no differences between WT and Zfp106−/−. Scale bar is 20 μm. (G and H) Representative toluidine blue stained sections of lumbar L4 and L5 dorsal roots from P9 WT (G) and Zfp106−/− (H) mice. Scale bar is 20 μm. (I) Distribution graph relating g-ratio to axon diameter from dorsal roots. Zfp106−/− mice have a significant shift in the frequency distribution towards a thinner axon diameter and an increased g-ratio compared with WT (P < 0.001). (J and K) Representative toluidine blue stained sections of the sciatic nerve from P9 WT (J) and Zfp106−/− (K) mice. Scale bar is 10 μm. (L) Distribution graph relating g-ratio to axon diameter for the sciatic nerve. Zfp106−/− mice show a significant shift in the frequency distribution towards a smaller axon diameter compared with WT animals (P < 0.001) but no change in g-ratio.

