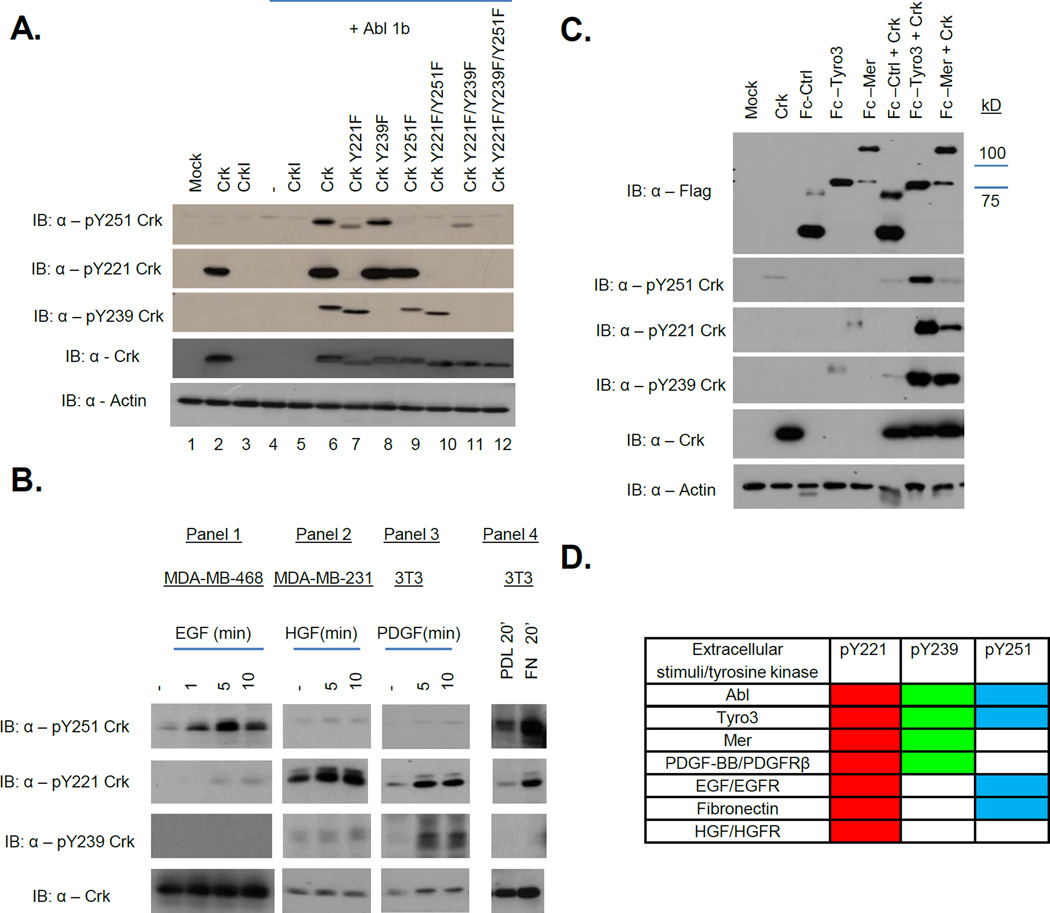
Figure 2. RTKs show distinct preferences for phosphorylation of Crk at Y221/Y239/Y251.
A and C, 293T cells were transfected with the plasmids indicated and lysates were analyzed by western blotting with the antibodies shown on the left. B, MDA-MB-468 cells were stimulated with EGF (panel 1), MDA-MB-231 cells with HGF (panel 2) and NIH 3T3 cells with PDGF-BB (panel 3) for the times indicated or plated on Poly-D-Lysine or Fibronectin coated dishes for 20 minutes (panel 4). Samples were analyzed by western blotting with the antibodies indicated on the left. D, Summary of Crk phosphorylation patterns observed. Red, green and blue indicate positive for pY221, pY239 and pY251 respectively.

