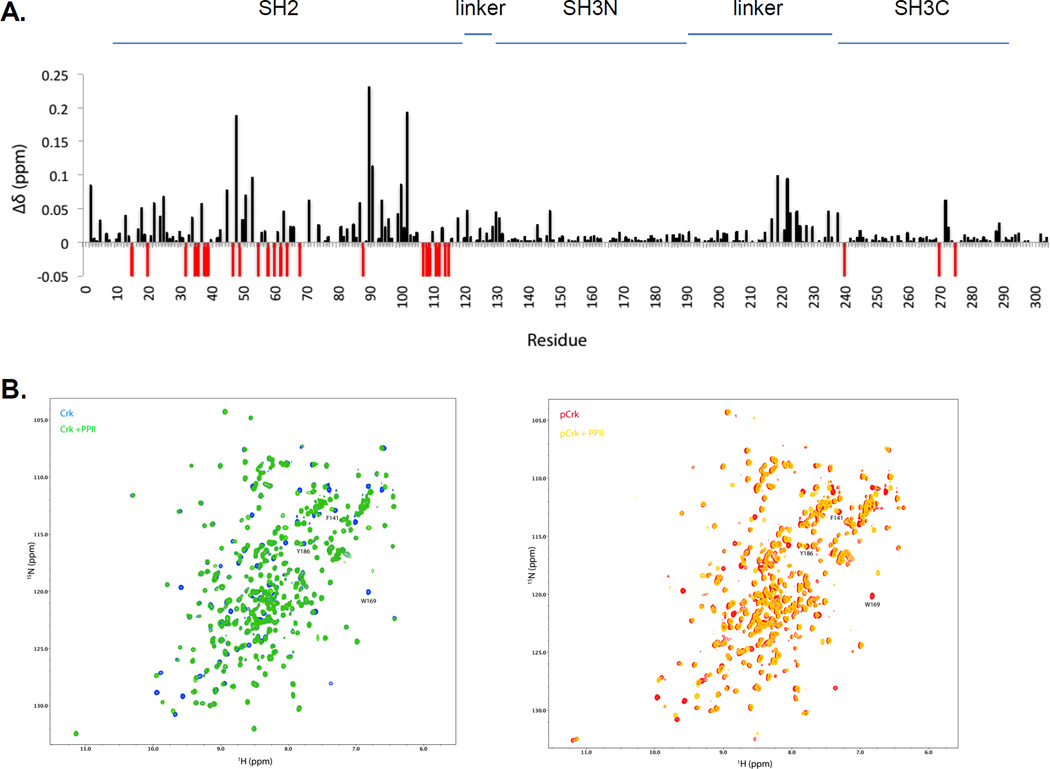
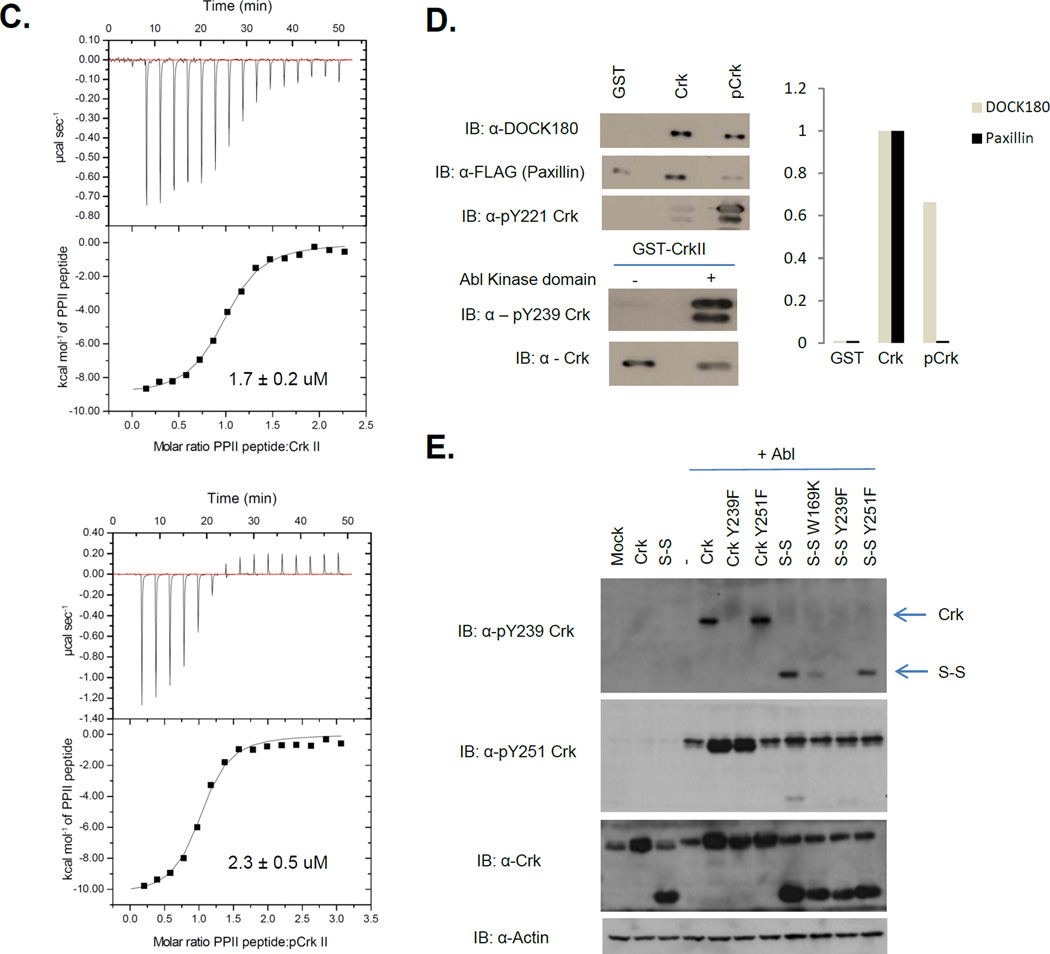
Figure 3. Crk SH3N is accessible to ligands in pY221-Crk.
A, 1H-15N chemical shift differences between Crk and pCrk. ∆δ values are on y-axis and amino acid numbers are on the x-axis. Red bars reflect the residues with significant line broadening or for which the perturbation value cannot be computed. B, (Left) Overlay of 1H-15N HSQC of Crk (blue) and Crk + PPII ligand (green). (Right) Overlay of 1H-15N HSQC of pCrk (red) and pCrk + PPII ligand (yellow). C, ITC profiles of Crk (top) and pCrk (bottom) with the PPII peptide ligand. Kd values are displayed as inset. D, Pull downs with purified GST, unphosphorylated GST-Crk and in vitro phosphorylated GST-Crk from 293T cell lysates expressing Flag-paxillin. Samples were analyzed with anti-DOCK180, anti-Flag and anti-pY221 Crk antibodies, anti- pY239 Crk and anti-Crk antibodies. Quantification is shown with binding of DOCK180/flag-paxillin to GST control set to zero and binding to unphosphorylated Crk set to 1. E, 293T cells were transfected with the plasmids indicated and lysates were analyzed by western blotting with the antibodies shown on the left. S-S refers to the Crk SH3N-linker SH3C construct (amino acids 123–304).


