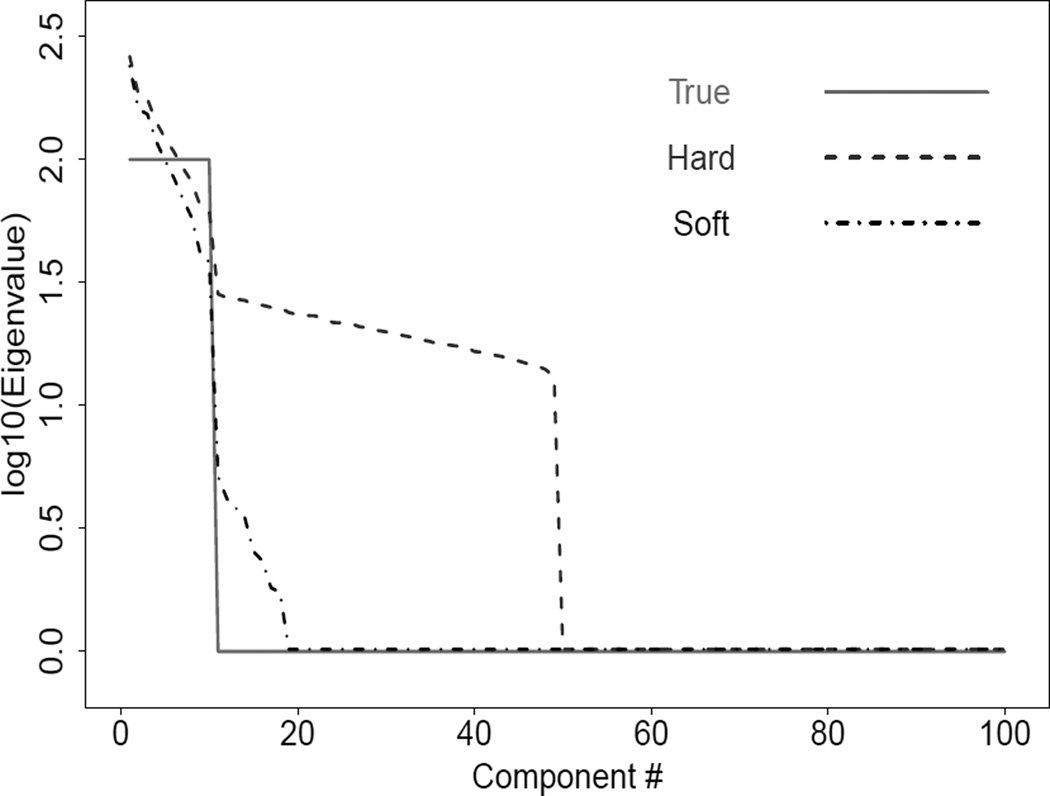
Figure 1.
True and estimated covariance matrix eigenvalues based on the hard- and soft-thresholding methods for a simulated data set with d = 1000 and n = 50. This shows that some eigenvalues are highly over-estimated by the hard thresholding method. The soft thresholding method gives major improvement for this example.

