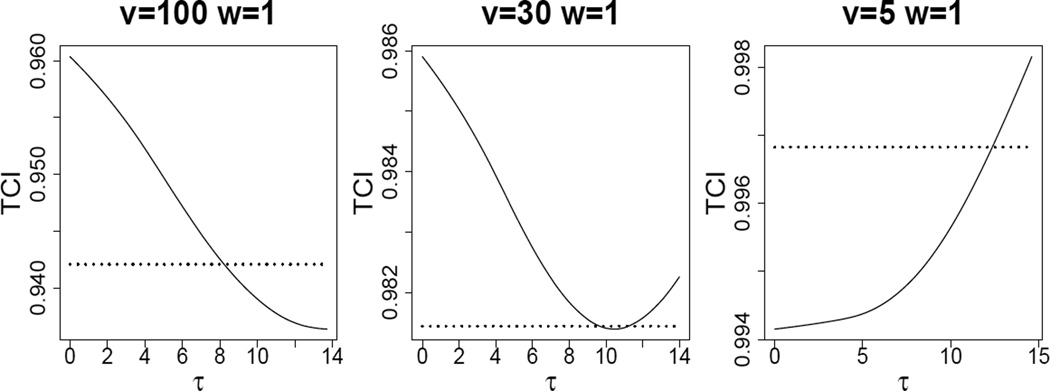
Figure 2.
Relationships between TCI and tuning parameter τ for three different settings (solid line). Dotted lines represent the TCI calculated from true eigenvalues. Shows situations where hard thresholding is anti-conservative (left panel), where energy preserving soft thresholding is anti-conservative (right panel), and where τ⋆ is strictly between the two (central panel).

