
FIGURE 2.
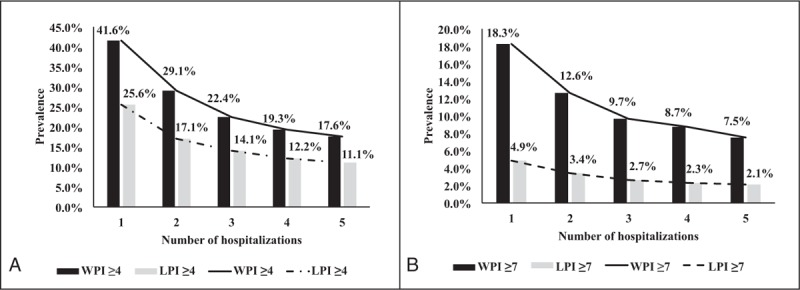
Trends in the CSP prevalence from the 1st to the 5th hospitalization. The 5th hospitalization was viewed as a reference group to determine the CSP differences for WPI and LPI of (A) ≥4 or (B) ≥7 points using linear mixed models. (A) For WPI ≥ 4, 1st versus 5th times (P < 0.001); 2nd versus 5th times (P < 0.001); 3rd versus 5th times (P < 0.001); and 4th versus 5th times (P = 0.021). For LPI ≥ 4, 1st versus 5th times (P < 0.001); 2nd versus 5th times (P < 0.001); 3rd versus 5th times (P < 0.001); and 4th versus 5th times (P = 0.088). (B) For WPI ≥ 7, 1st versus 5th times (P < 0.001); 2nd versus 5th times (P < 0.001); 3rd versus 5th times (P < 0.001); and 4th versus 5th times (P = 0.027). For LPI ≥ 7, 1st versus 5th times (P < 0.001); 2nd versus 5th times (P < 0.001); 3rd versus 5th times (P = 0.063); and 4th versus 5th times (P = 0.490). CSP = clinically significant pain, LPI = last evaluated pain intensity, WPI = worst pain intensity.