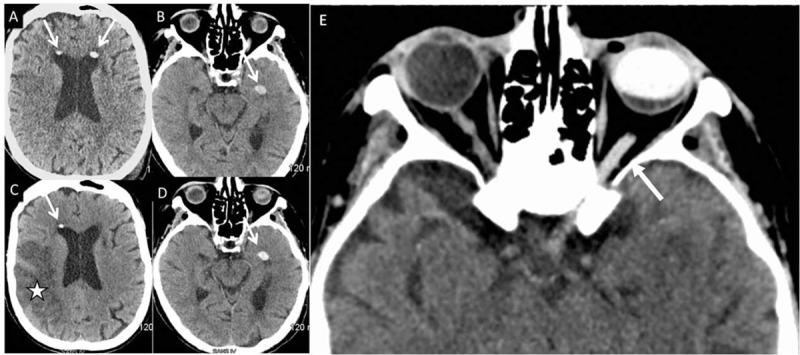
FIGURE 1.

Day 0 (A, B) and day 2 (C, D) axial noncontrast-enhanced brain CT scans (same sections: A = C; B = D) showing moving intraventricular hyperdensities (arrows) and a cerebral infarction (star). E: hyperdensity of the left optic nerve (arrow) and the left ocular globe. CT = computed tomography.
