
Fig. 2.
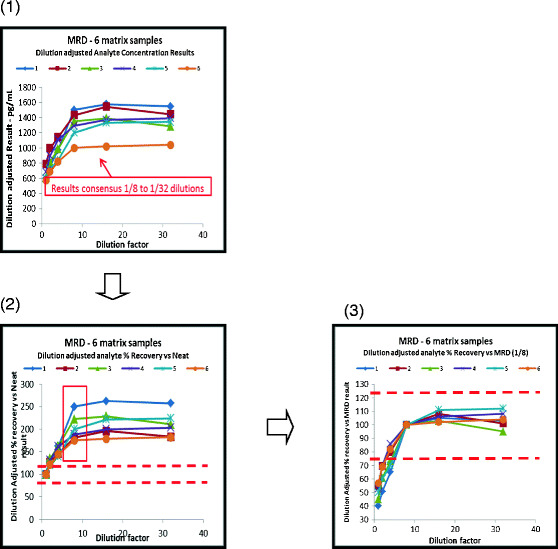
Calculation of optimal minimum required dilution (MRD): results of parallelism assessment for six individual matrix samples for a single analyte. In this figure, non-parallelism is apparent over part of the dilution range. Where there is parallelism across neat and diluted samples, no dilution will be required (1). The first chart shows test results adjusted for the dilution factor for all dilutions plotted against the actual dilution. In this example, the results increase as the dilution increases (due to matrix interference of some type) until it levels out. A consensus of results is observed once the interference effects have been sufficiently diluted out. In this chart, the dilutions from 1/8, 1/16, and 1/32 appear to have good consensus. This effectively indicates that an MRD of 1/8 is potentially needed (2). The second chart shows the same data calculated as % recovery using the neat sample result as the 100% target value. The red dashed lines are the acceptance limits for this particular case, and clearly, the results fall out with those, due to the matrix interference in the inadequately diluted samples (3). The next step to prove that the variance from 1/8 to 1/32 results is acceptable is to recalculate the % recovery but now using the 1/8 dilution results as the 100% target. Here, the variance of higher dilutions up to 1/32 meets the acceptance criteria and proves that the MRD is 1/8. It also shows that diluting samples up to 1/32 would achieve acceptable results. Parallelism is therefore shown between the 1/8 and the 1/32 dilutions. This example shows a single analyte across six individual matrix samples. It may be more appropriate to use a larger number of samples when conducting this test, although there is often difficulty in obtaining matrix with significant concentrations of the biomarker of interest to allow multiple dilutions to be assessed that result in levels within the analytical range. It is recommended that this experiment is conducted for every analyte in the multiplex panel. It is usually easier to assess data results in this way on an analyte-by-analyte basis rather than by presenting multiple analytes together from a single sample