
Fig. 3.
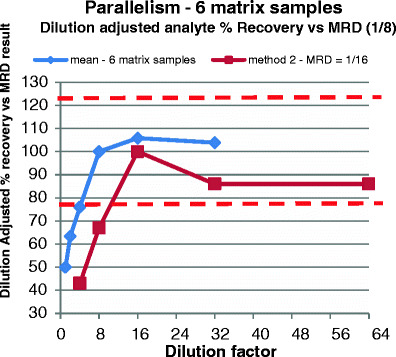
Determining parallelism when sufficient endogenous marker is present in matrix. Red dashed line indicates assay acceptance limits (≤23%—equivalent to ±3× inter-assay CV% for these particular methods). This is a parallelism experiment covering two different analytes. The lines represent mean % recovery of six different matrix samples. It demonstrates that there is a matrix interference effect when using a dilution of less than 1/8 (analyte #1—blue) or 1/16 (analyte #2—brown). Consensus is achieved over the dilution range of 1/8 to 1/32 and 1/16 to 1/64, respectively. Hence, different analytes may demonstrate different MRDs, and so for multiplexed assays, the analytical ranges and sensitivities of all the analytes combined may be compromised due to one or more analytes that require different MRDs. In this example, a dilution of 1/16 minimum must be used to capture valid results from both analytes. Larger multiplexes may give more differences, but overall, the largest MRD required will need to be used unless certain analytes are withdrawn from the panel. This could be because the resulting analytical range or sensitivity limits of the analytes are unsatisfactory due to the particular requirements of the project