Fig. 1.

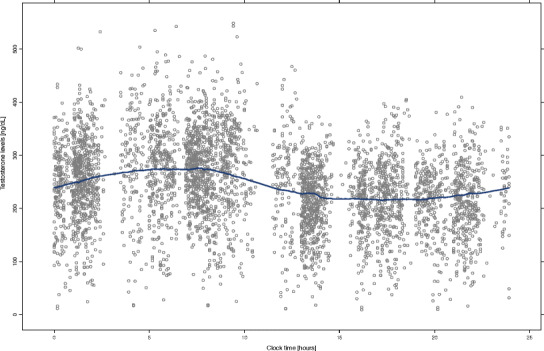
Time course of the baseline testosterone levels in hypogonadal men. Gray points represent observations. The blue line represents the smooth regression line

Time course of the baseline testosterone levels in hypogonadal men. Gray points represent observations. The blue line represents the smooth regression line