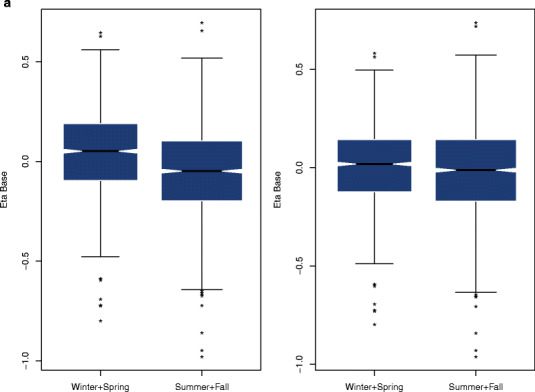
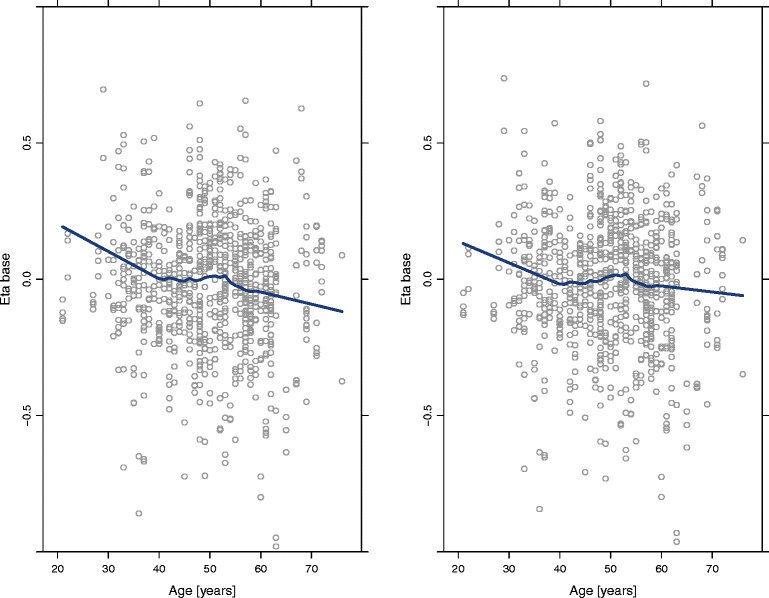
Fig. 2.


a Distribution of the interindividual variability (eta) of Base by season before (left panel) and after (right panel) including the effect of season in the model. Asterisks represent outliers. b Correlation between the interindividual variability (eta) of Base and age before (left panel) and after (right panel) including the effect of age in the model. The blue solid line represents the smooth regression line
