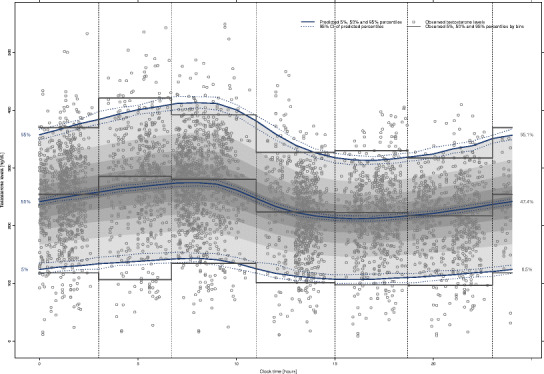
Fig. 4.

Visual predictive check of the model developed to characterize the time course of the testosterone levels in hypogonadal men. Blue lines represent the predicted 5th, 50th, and 95th percentiles of the testosterone concentrations. Dotted blue lines represent the 95% prediction interval (PI) of these percentiles. The shaded gray area represents the 90% prediction interval (PI) predicted for the model. Vertical dotted lines represent the selected bins. Gray solid lines represent the observed 5th, 50th, and 95th percentiles of testosterone concentrations in each bin. Figures at the margin of the plot represent the theoretical (left) and observed (right) percentage of observations below percentiles 5th, 50th, and 95th
