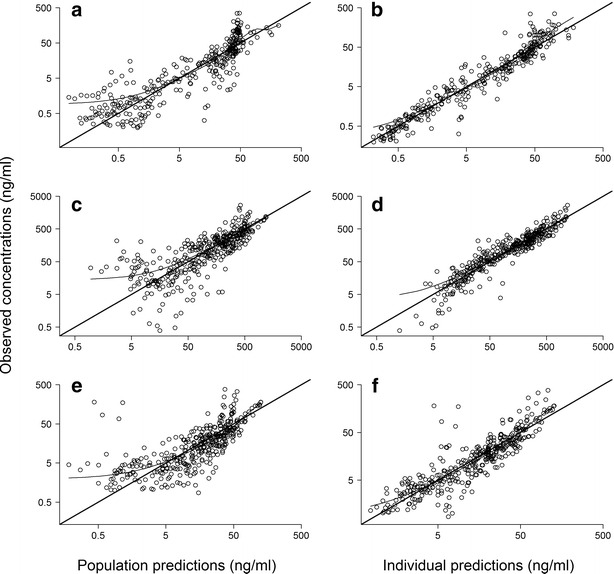
Fig. 4.

Goodness-of-fit plots for the final population pharmacokinetic model of morphine and its metabolites showing observed versus population (left column) and individual predicted concentrations (right column) for morphine (a and b), M3G (c and d), and M6G (e and f). Concentrations are shown on logarithmic scales
