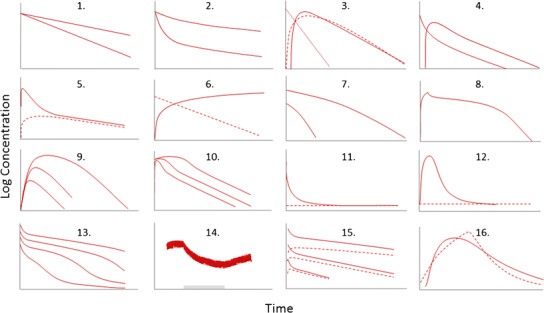
Fig. 2.

Schematic illustration of the 16 data patterns discussed in this report. 1 Two individuals with mono-exponential disposition. 2 Bi-exponential decline after iv bolus dosing in two groups of animals. 3 Lag time or no lag time in the absorption process with absorption rate-limited elimination. 4 Simultaneous analysis of bi-exponential decline after iv dosing and mono-exponential decline when dosing orally. 5 Multi-exponential behavior after oral dosing. 6 Plasma and cumulative urine data. 7 Single-compartment disposition coupled to nonlinear elimination. 8 Multi-compartment disposition coupled to nonlinear elimination. 9 Nonlinear elimination after oral dosing. 10 Saturable absorption by transporters. 11 Bi-exponential decline after bolus dosing with a baseline value. 12 Extravascular administration of an endogenous compound with a baseline value. 13 Target-mediated drug disposition. 14 Multiple dosing coupled to a period of hetero-induction shown by the gray horizontal bar. 15 Nonlinear formation of metabolite (dashed lines) after iv dosing of parent compound (solid lines). 16 First- and zero-order absorption patterns. All plots are semi-logarithmic except 12, 14, and 16 where data are displayed on a linear scale due to a limited concentration range.
