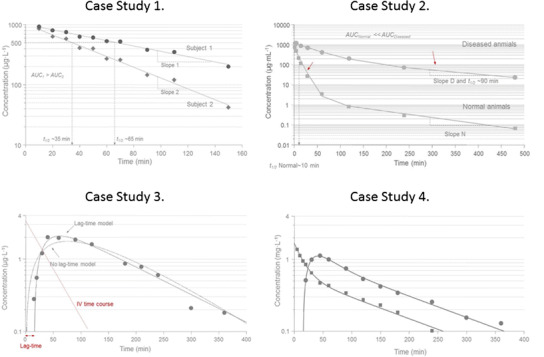
Fig. 4.

Case study 1 Semi-logarithmic plot of concentration-time data in two subjects after a rapid intravenous injection of the same dose. An apparent mono-exponential decline is shown in plasma corresponding to a one-compartment system. The back-extrapolated concentration at time zero is approximately 1000 μg L−1 in both subjects suggesting the same volume of distribution. Clearance Cl of test compound is larger in subject 2 which is manifested in a smaller area-under-the plasma concentration-time curve AUC and a shorter half-life (35 min) as compared to subject 1 (65 min). Case study 2 Semi-logarithmic plot of concentration-time data in two groups of rats after a rapid intravenous injection of the same dose of recombinant human superoxide dismutase (rh-SOD). An apparent bi-exponential decline is shown in plasma corresponding to a two-compartment system (right). The back-extrapolated concentration at time zero is approximately 1000 μg mL−1 in both groups suggesting similar central volumes of distribution. Clearance Cl of the test compound is larger in normal rats which is manifested in a smaller AUC. The small red arrows indicate the elimination phase in normal (initial phase) and clamped (diseased, terminal phase) rats. The effective half-life is about 10 min (close to initial phase) in normal animals as compared to 90 min (terminal phase) in clamped animals. Cld, V c, and V t denote inter-compartmental distribution parameter and central and peripheral volume terms, respectively. V ss is the sum of the two volume terms. Case study 3 Semi-logarithmic plot of concentration-time data in one subject after an oral dose. An apparent initial delay in the rise of plasma test compound concentrations is followed by a rapid initial upswing with a C max at about 60 min and then a post-peak mono-exponential decline corresponding to a one-compartment input/output system (right). Superimposed on experimental data (filled symbols) are the lag time and no lag time model fits. Note how the lack of a lag time misses the initial 10–20-min delay, the rise in experimental data, the peak concentration, and over predicts the terminal time points. A tentative time course after intravenous administration is shown as a dotted red line. This implies that the terminal portion of oral data shows absorption rate-limited elimination—flip-flop pharmacokinetics. Cl, F, K a, and t lag denote clearance, bioavailability, absorption rate constant, and lag time, respectively. Case study 4 Semi-logarithmic plot of concentration-time data in one subject after intravenous and oral dosing at two different occasions. Intravenous data (solid squares) display a bi-exponential decline which suggests a typical two-compartment disposition (see model inset). Oral data shows an apparent initial delay in the rise of plasma test compound concentrations which is then followed by a rapid initial upswing with a C max at about 50 min and then a post-peak weak bi-exponential decline (solid circles). Data from both routes of administration were simultaneously fit by the two-compartment model with either bolus or first-order input. Cl, V c, V t, Cld, F, and K a denote clearance, central volume, peripheral volume, inter-compartmental distribution, bioavailability, and absorption rate constant, respectively.
