
Fig. 5.
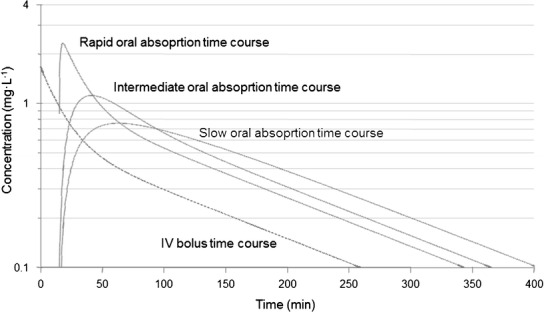
Semi-logarithmic plot of simulated concentration-time data after intravenous dosing (bi-exponential decline bending at 50 min) and oral dosing with three different absorption rate constants K a. The oral profile displays bi-phasic decline post-peak when absorption rate is high and mono-exponential decline post-peak when the absorption rate is low which then masks disposition.