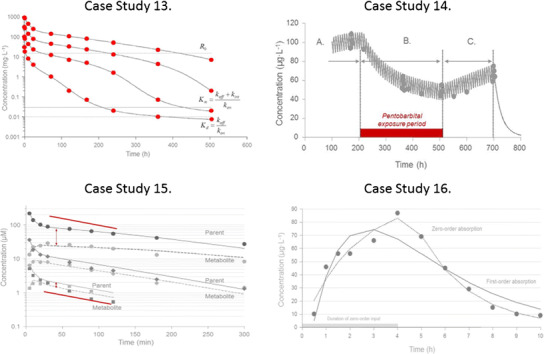
Fig. 8.

Case study 13 Semi-logarithmic plot of observed (symbols) and TMDD model-predicted concentrations (solid lines) at four different doses of 1.5, 5, 15, and 45 mg kg−1 after rapid intravenous injections of a monoclonal antibody. Note that the ligand displays a multi-compartment target-mediated disposition pattern that changes in shape with the change in ligand exposure (dose). The plot also shows the plasma target baseline concentration R 0, the estimated Michaelis-Menten constant K m, and the dissociation constant K d (7). Case study 14 Observed (filled circles) and predicted (solid line) plasma concentrations of nortriptyline (10 mg tid) before (A, 0–216 h), during (B, 216–516 h), and after (C, 516–700 h) pentobarbital Pb treatment. The horizontal bar represents the induction period. Data are displayed on a Cartesian scale due to the limited concentration range which more clearly highlights the key features. Case study 15 Observed (filled symbols) and model predictions (lines) of parent compound (solid lines) and metabolite (dashed lines) plasma concentration-time data. Note the change in half-life with increasing concentrations. The intravenous bolus doses of drug were 10, 50, and 300 μmol kg−1. The red solid lines are included as a visual help with respect to how the slope changes across low and high exposure data. Note the separation between parent C and metabolite C M concentrations with increasing doses of parent compound. C, V c, V t, Cld, ClM, V max, K m, V M, and k ME denote the parent plasma concentration, central volume, peripheral volume, inter-compartmental distribution, metabolic clearance of parent compound, maximum metabolic capacity, the Michaelis-Menten constant, volume of distribution of metabolite, and elimination rate constant of metabolite, respectively. Case study 16 Observed (filled symbols) and model-predicted (lines) concentration-time data following an oral dose of 20 mg of compound A. The zero-order absorption model predicts a discontinuous line at approximately 4 h. The gray horizontal line illustrates the length of constant rate drug input T abs. The first-order model misses the peak concentration and displays systematic deviations between observed and model-predicted concentrations. Note the delayed absorption with a maximum observed plasma concentration at 4 h. K a, T abs, V (actually V/F), and K denote the absorption rate constant, duration of the zero-order absorption, volume of distribution, and elimination rate constant, respectively. Data are displayed on a Cartesian scale due to the limited concentration range which more clearly highlights the key features.
