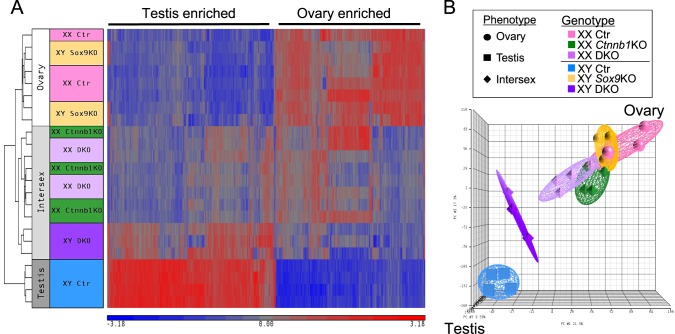
FIG. 3.
Transcriptome analyses of 14.5 dpc control, Ctnnb1 single KO, Sox9 single KO, and Ctnnb1/Sox9 DKO XX and XY gonads. A) The heat map of the sexually dimorphic genes at 14.5 dpc (fold change ≥ 2 and P < 0.05) consists of three clusters that follow the gonadal phenotypes: ovary (XX control and XY Sox9 KO), intersex (XX Ctnnb1 KO, XX Ctnnb1/Sox9 DKO, and XY Ctnnb1/Sox9 DKO), and testis (XY control). Red indicates high expression and blue for low expression. B) Principal component analysis (PCA) shows that XX Ctnnb1 KO and XX Ctnnb1/Sox9 DKO transcriptomes show a shift toward a testis profile, whereas XY Ctnnb1/Sox9 DKO transcriptome is even more masculinized.

