
Fig 1. Time evolution of the JD radius of gyration (a) and hairpin angle (b) throughout the MD trajectory of each replica.
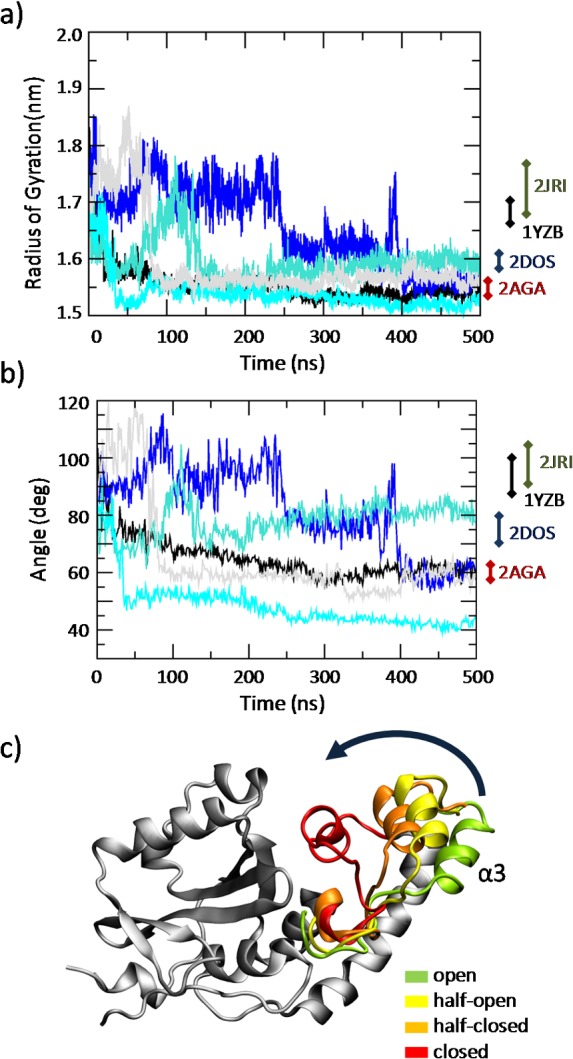
(c) Visual inspection of the JD conformations taken from the classical MD simulations. The MD trajectories reveal a JD transition from an open state to a closed state, through an half-open and half-closed state. For each snapshot the α3 region (Asp57-Leu62) is highlighted with a different color: green (open), yellow (half-open), orange (half-closed) and red (closed).