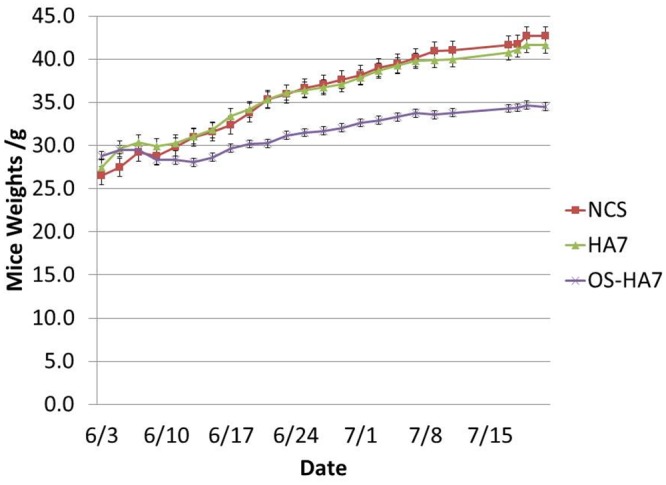
Fig 1. Average mice weight gain for the three diets over the duration of behavioral testing.

The weights of the mice were determined every other day for the duration of testing. Values represent the mean weight in each group ± SEM, n = 16/group.

The weights of the mice were determined every other day for the duration of testing. Values represent the mean weight in each group ± SEM, n = 16/group.