
Fig 8. p-values for the differences (Kruskal-Wallis and Wilcoxon Rank Sum tests) in relative abundance of genus (or family).
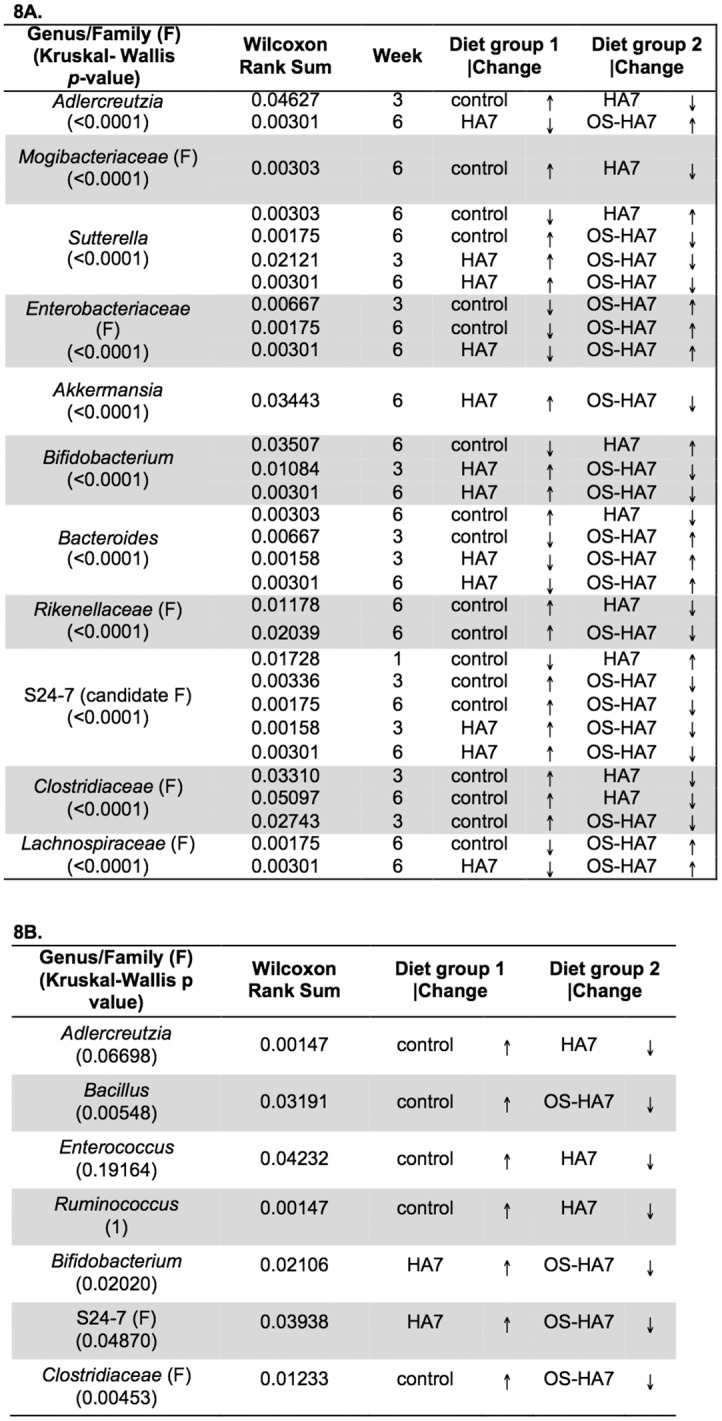
Samples from feces (8A) and cecal contents (8B) were analyzed from weeks 1, 3, and 6 for each diet. Only those taxa with significant p-values are shown. Arrows indicate if members of the phyla are more (↑) or less (↓) abundant.