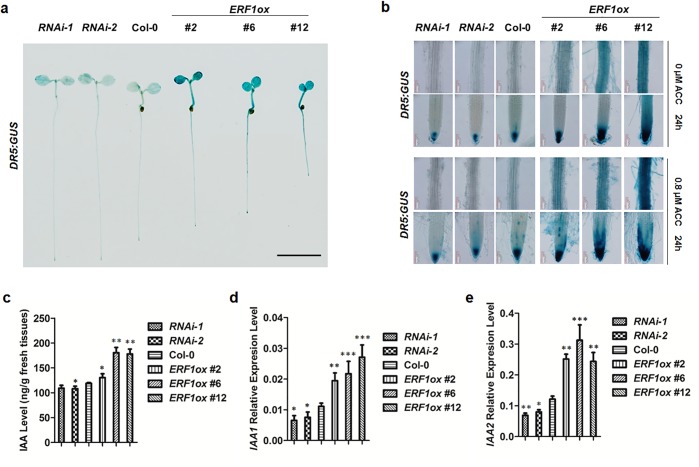
Fig 3. ERF1 enhances auxin accumulation in roots.
(a) DR5:GUS expression in 5-day-old seedlings of Col-0,ERF1 knockdown (RNAi-1, RNAi-2) and overexpression lines (ERF1ox #2, ERF1ox #6, ERF1ox #12). Three independent experiments were done, and each replica containing 15 plants for each line. Representative seedlings were photographed. Scale bar, 0.5 cm. (b) DR5:GUS expression in maturation region and root tip of primary root. Five-day-old seedlings of Col-0, ERF1 knock-down (RNAi-1, RNAi-2) and over-expression (ERF1ox #2, ERF1ox #6, ERF1ox #12) lines were treated with 0 or 0.8 μM ACC for 24 h before GUS activity was assayed. More than 20 plants were observed for each line. Representative photos were displayed. (c) Free IAA content. Seeds of ERF1 overexpression and RNAi lines were grown on MS plates for 5 d before root IAA content was measured. The mean ± SD of three replicas is shown (*P<0.05, **P<0.01). Asterisks indicate Student’s t-test significant differences. (d-e) The transcript level of IAA1 and IAA2. Seeds of ERF1 overexpression and RNAi lines were grown on MS plates for 5 d before RNA isolation from the roots. Transcript abundance of IAA1 and IAA2 was measured using qRT-PCR. The mean ± SD of three replicates is shown (*P<0.05, **P<0.01, ***P<0.001). Asterisks indicate Student’s t-test significant differences.

