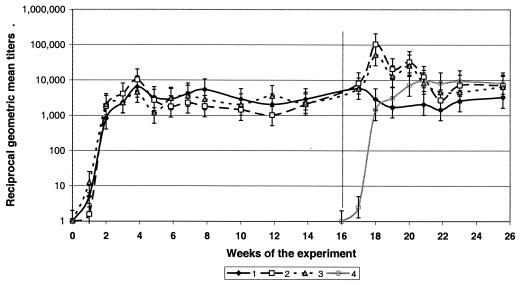
FIG. 2.
Dynamics of antibody titers in BALB/c mice originally infected with A. phagocytophilum Dawson isolate and challenged with homologous or heterologous isolates. Group 1, unchallenged control; group 2, homologous challenge (Dawson-Dawson); group 3, heterologous challenge (Dawson-Gaillard); group 4, pathogen-naive control. The vertical line indicates placement of challenging ticks. Error bars show standard deviations.

