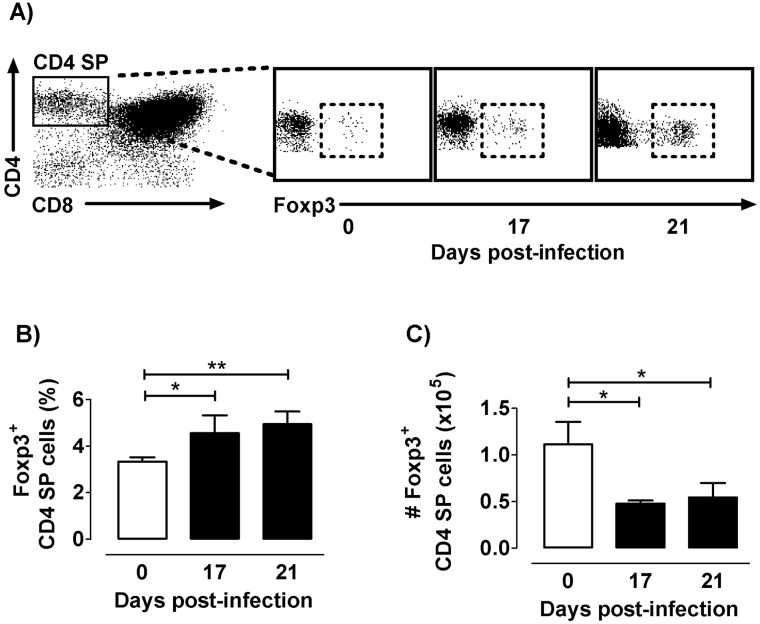
Fig 1. Foxp3 expression among CD4 SP cells along infection.
a) Representative dot plots obtained by flow cytometry showing CD4 SP gathered among total thymocytes and Foxp3 expressing cells among CD4 SP cells during the course of infection. b) Frequency of Foxp3+ cells among CD4SP thymocytes. c) Absolute number Foxp3+ cells among CD4SP thymocytes. Values are mean ± s.e.m. of 5–8 mice/day one representative of six experiments performed independently in C57BL/6 mice infected with Tulahuén strain. * p <0.05 and ** p<0.01.

