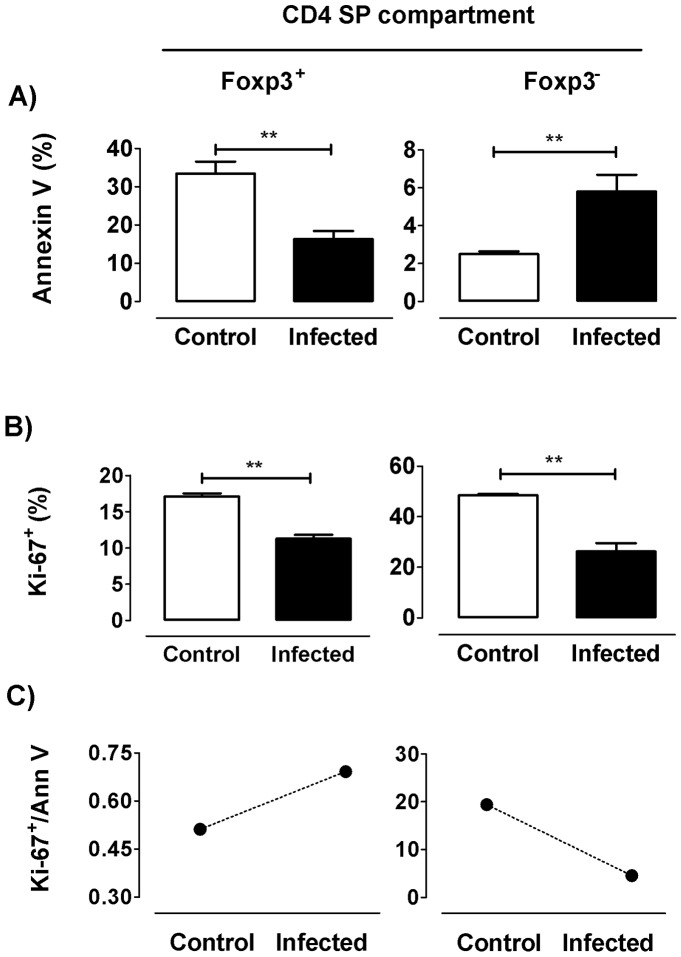
Fig 2. Death and proliferative response of tTregs during T. cruzi infection.
Flow cytometric analysis was achieved in thymocytes from control and 17 days-infected animals. a) Frequency of annexin V+ cells among each Foxp3-defined CD4 SP subpopulation. b) Frequency of Ki-67+ cells among each Foxp3-defined CD4 SP subpopulation. c) Ki-67/annexin V ratio in control and infected animals within the different subpopulations. Values are mean ± s.e.m. of 3–6 mice/day. One representative of two experiments performed independently in C57BL/6 mice infected with Tulahuén strain. ** p<0.01.

