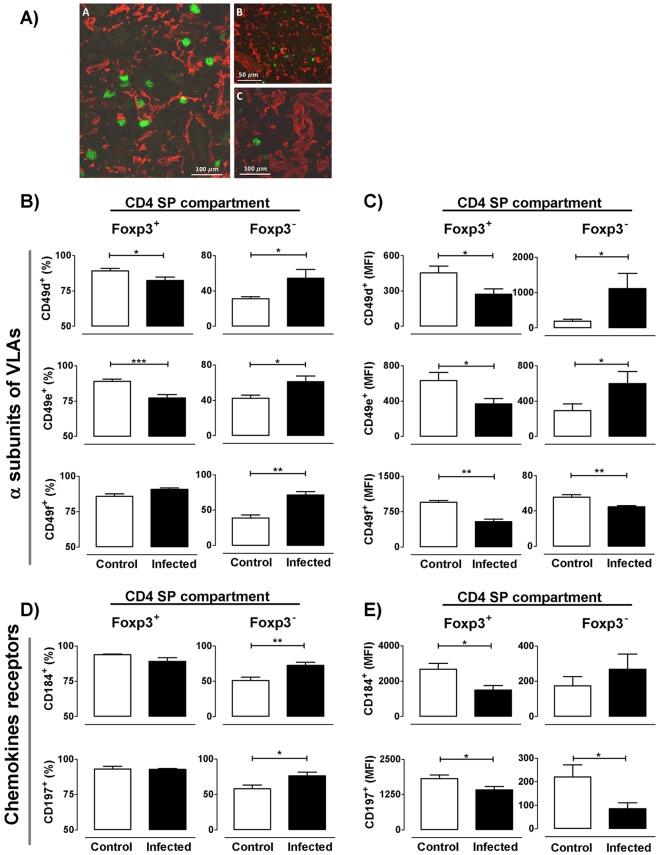
Fig 7. Alterations in migratory-related molecules among Foxp3 expressing cells during infection.
a) Localization by immunofluorescence of cytokeratins, extracellular matrix molecules and Foxp3+ cells in the thymus of normal (Panel A) and 17 days-infected mice (Panels B and C). Panel A shows medullary Foxp3+ cells in close contact with the medullary epithelial stroma (denoted by cytokeratin red staining). Panels B and C show Foxp3+ cells located in regions with high extracellular matrix network density, as seen by staining with the anti-laminin antibody (red staining, panel B) and anti-fibronectin (red staining, panel C). b) Frequency of integrin α chains CD49d, CD49e and CD49f within CD4+Foxp3+ and CD4+Foxp3- cells. c) Mean fluorescence intensity (MFI) of each integrin α chain within CD4+Foxp3+ and CD4+Foxp3- cells. d) Frequency of chemokine receptors CD184/CXCR4 and CD197/CCR7 within CD4+Foxp3+ and CD4+Foxp3- cells. e) MFI of each chemokine receptor within CD4+Foxp3+ and CD4+Foxp3- cells. Data are expressed as mean ± s.e.m. of 3–6 mice/day, after 17 days p.i. and exemplify one representative of three experiments performed independently in BALB/c mice infected with Y strain. * p <0.05; ** p<0.01 and *** p<0.001.

