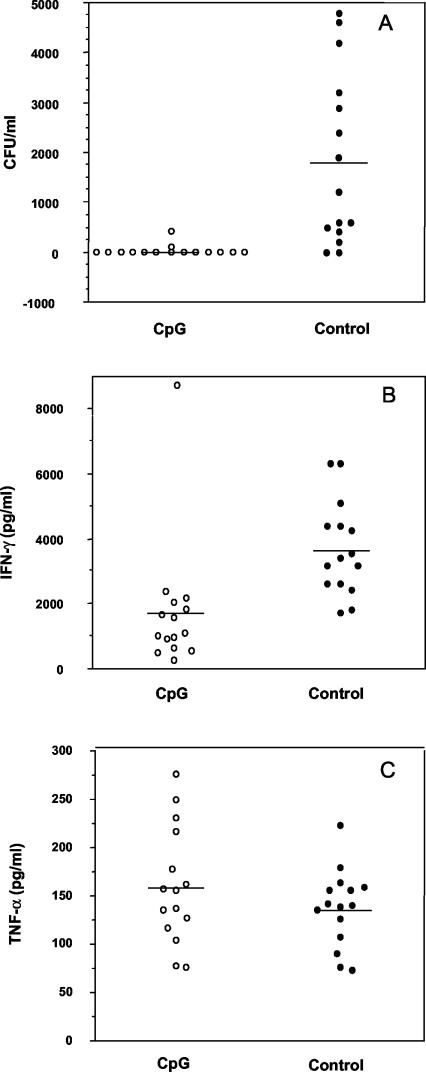
FIG. 1.
Effect of CpG ODN 1826 pretreatment on bacterial load expressed as CFU (A), IFN-γ levels (B), and TNF-α levels (C). BALB/c mice were injected with either CpG ODN 1826 (○) or PBS (•) on day −2 relative to the time of B. pseudomallei challenge (50 LD50) on day 0. Blood was collected on day 2, and each specimen was used for colony count and cytokine assays. Results from individual mice (n = 15 animals per group) and group means (horizontal line) are shown. Data are representative of three independent experiments. Differences between the CpG and control groups were statistically different for panels A (P = 0.0001) and B (P = 0.0002) by the Mann-Whitney U test.

