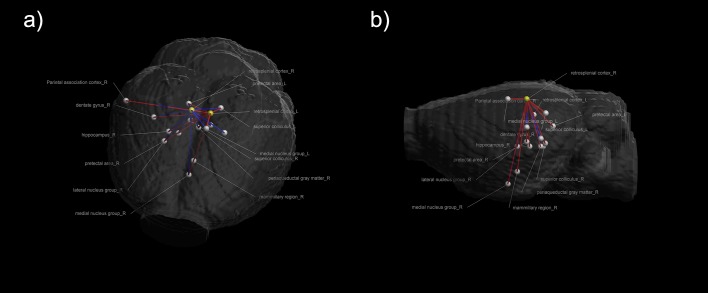
Fig 3. Views of functional networks with the bilateral RSCs shown in the three-dimensional rat brain model from two directions: (a) from top to down and (b) from right to left.
The two nodes presented in yellow represent the bilateral RSCs. The white color indicates all of the related regions which that are functionally connected to the bilateral RSCs. The red and blue lines represent the functional connections with the left and right RSCs, respectively.

