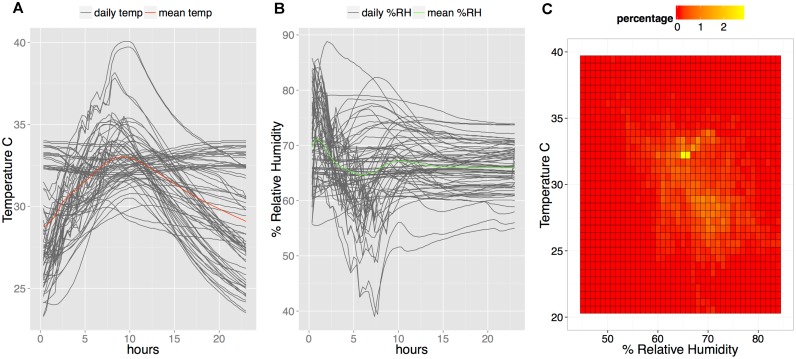
Fig 4. Environmental conditions during surveillance activities in Togo 2013 and 2014.
A. Daily temperature profiles (dark grey lines) in degrees Celsius during surveillance activities. The mean temperature is plotted with the bold red line. B. Daily % relative humidity (dark grey lines) cycles during surveillance activities. The mean relative humidity is plotted with the bold green line. C. Frequency of recorded temperature and relative humidity pairs experienced by monitors attached to microscopes used during the surveillance activities. The color scale represents the frequency of observations represented by intense red (least frequent) to intense yellow (most frequent).

