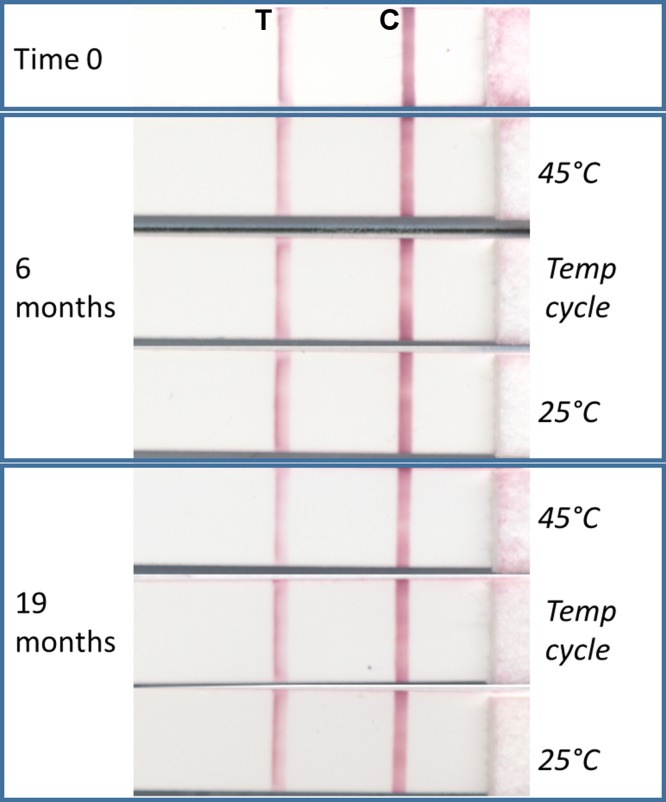
Fig 5. Lateral flow test strip scanned images showing test line (‘T’, left) and control line (‘C’, right) results after using as samples the dried anti-Ov16 IgG4-positive control subjected to elevated temperature stress over time.
Time zero shown indicates intensity of the starting signal prior to storage at 25°C, 45°C, and variable cycling temperature (20°C to 40°C, daily) for up to 19 months.

