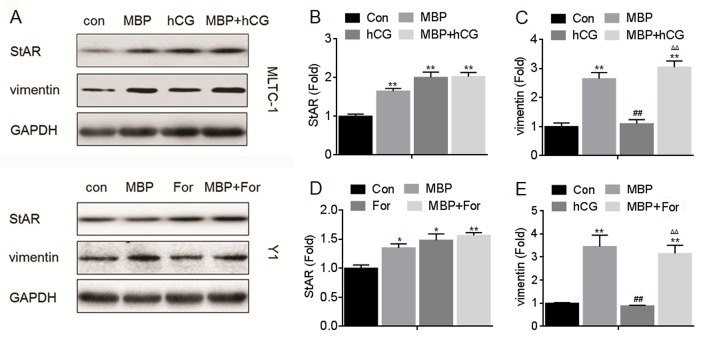
Fig 4. Effects of MBP and hCG/For on the expressions of StAR, p450scc, 3β-HSD, vimentin, β-actin, and tubulin.
MLTC-1 and Y1 cells were exposed to1000 nM MBP in the absence or presence of 100 U/L hCG or 10 μM forskolin for 24 h, respectively. (A) Western blots analysis and relative protein levels of (B) StAR, (C) p450SCC, (D) 3β-HSD, (E) vimentin, (F) β-actin, and (G) tubulin. **p<0.01 compared with medium control cells; ##p<0.01 compared with cells treated by MBP alone; ΔΔp<0.01 compared with cells treated by hCG or For alone.

