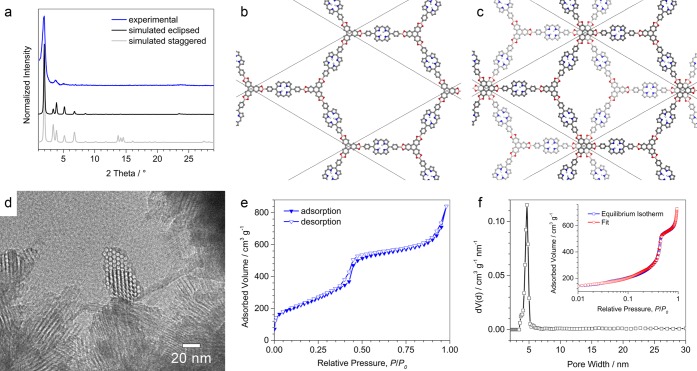
Figure 2.
(a) Experimental PXRD data (blue) vs simulated patterns (black and gray) for (b) eclipsed and (c) staggered arrangements of the 2D layers. The theoretical patterns were simulated for a crystallite size of 50 nm. (d) Transmission electron micrograph of TP-Por COF bulk material showing the hexagonal pore structure (middle) and straight porous channels (bottom). (e) Nitrogen sorption isotherm of a TP-Por COF powder sample measured at 77 K. (f) Corresponding pore size distribution with an average pore size of 4.6 nm obtained by fitting the experimental data using a QSDFT equilibrium model (inset).

