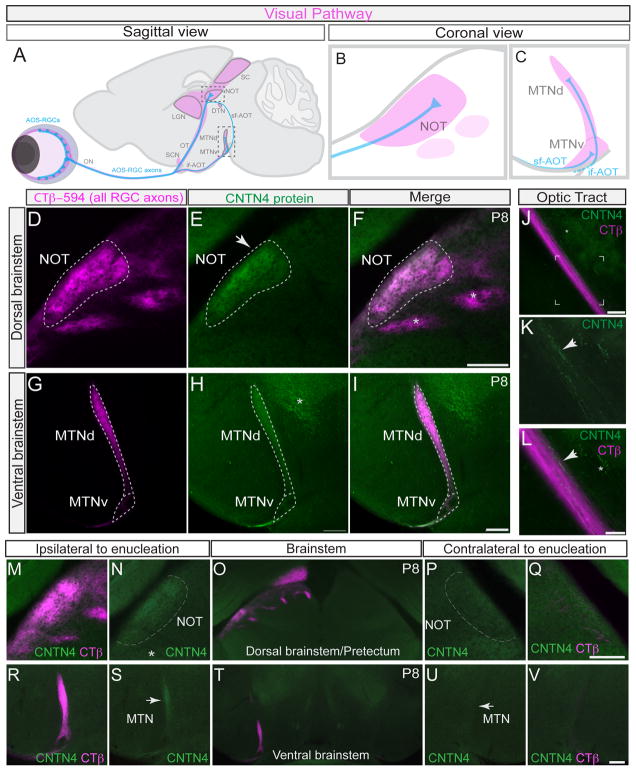
Figure 1. Contactin-4 is selectively expressed by axons of AOS-projecting RGCs.
(A–C) Mouse visual pathway. Blue: accessory optic system (AOS)-projecting RGCs and axons. Magenta: retinorecipient targets.
(A) Sagittal view, visual pathway; sf-AOT: superior fasciculus of the accessory optic tract. if-AOT: inferior fasciculus of the accessory optic tract; DTN: dorsal terminal nucleus; SCN: suprachiasmatic nucleus; LGN: lateral geniculate nucleus; SC: superior colliculus (B and C) coronal views of accessory optic system (AOS) targets, (B) the nucleus of the optic tract (NOT) and (C) the medial terminal nucleus, dorsal (MTNd) and ventral (MTNv) divisions.
(D–I) Contactin-4 (CNTN4) protein expression in AOS targets, the NOT and MTN.
(D) CTβ–594 (magenta) labeling of all RGC axons. (E) CNTN4 protein (green) is selectively expressed in the NOT. (F) Merge of D and E. Asterisks: retinorecipient targets that do not express CNTN4. Scale = 100μm
(G) CTβ–594 labeling all RGC axons. (H) CNTN4 protein expression in the medial terminal nucleus (MTN). Asterisk: CNTN4 expression outside of the visual system. (I) Merge of G and H. Scale = 100μm
(J–L) CNTN4 protein in axons in optic tract (OT). (J) CTβ–594/CNTN4 labeling. Scale in J = 200μm. (K) High magnification view framed region from (J). (L) Merged high magnification view of CTβ–594 and CNTN4. Scale in K, L = 100μm. Arrows in K and L: CNTN4+ axonal profiles. Asterisk: CNTN4 expression outside of the visual system.
(M–V) Effects of monocular enucleation on CNTN4 expression in the brain; Magenta: CTβ–594 labeling of RGC axons from intact eye; Green: CNTN4 protein expression.
(M–Q) CNTN4 expression in the NOT in the control (ipsilateral) hemisphere of the brain (M, N) and in the enucleated (contralateral) hemisphere of the brain (P, Q). Scale = 250μm. Asterisk: CNTN4 protein expression in other brain regions.
(R–V) CNTN4 expression in the MTN in the ipsilateral hemisphere (R, S) and contralateral hemisphere (U, V) of the brain. Scale = 250μm. Arrows: lateral border of the MTN.

