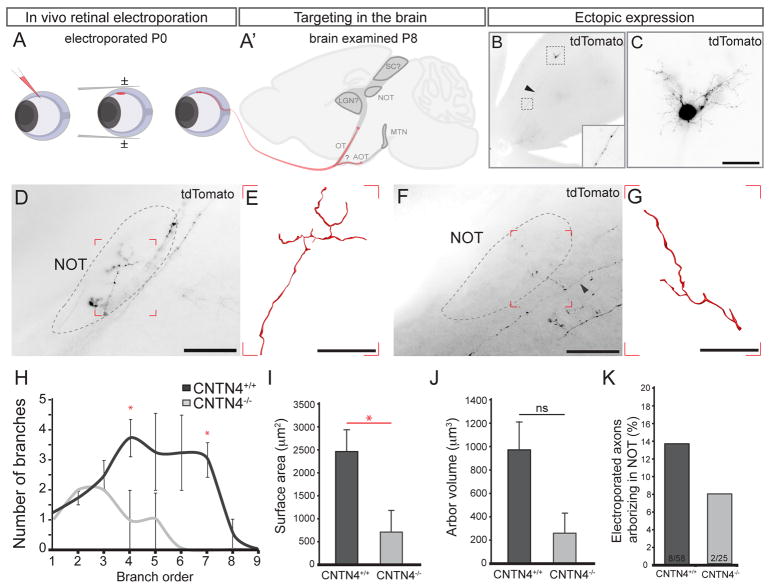
Figure 4. CNTN4 is required for accurate targeting and efficient arborization in the NOT.
(A, A′) In vivo electroporation. (A) Plasmid DNA is injected into the eye on P0, receives square waves pulses. (A′) P8 brains are examined for labeled RGC axons.
(B) Example of pCMV-tdTomato electroporated RGC. Arrowhead and inset: RGC axon expressing tdTomato. (C) High magnification of the RGC shown in (B) the RGC soma, dendrites and axon (arrowhead) express high levels of tdTomato. Scale = 125μm.
(D–G) Example of NOT-projecting tdTomato+ axons in wildtype (D, E) and CNTN4−/− mice (F, G); arrowhead: parent axon. (E) Wildtype, NOT-projecting RGC axon reconstruction from boxed region in D. (G) CNTN4−/−, NOT-projecting axon reconstruction from boxed region in F. Scale in D, F= 250μm., Scale in E, G = 50μm.
(H) Quantification of the average number (±SEM) of branches from branch order 1–8 for wildtype and CNTN4−/−, NOT-projecting axon (n=4 axons/mice wildtype, n=2 axons/mice CNTN4−/−).
(I) Quantification of the average arbor surface area for wildtype and CNTN4−/− mice (±SEM), p=0.040.
(J) Quantification of the average arbor volume for wildtype and CNTN4−/− mice (±SEM), p=0.062.
(K) The percentage of electroporated axons arborizing in the NOT after electroporation in wildtype (8/58) and CNTN4−/− (2/25) mice.

