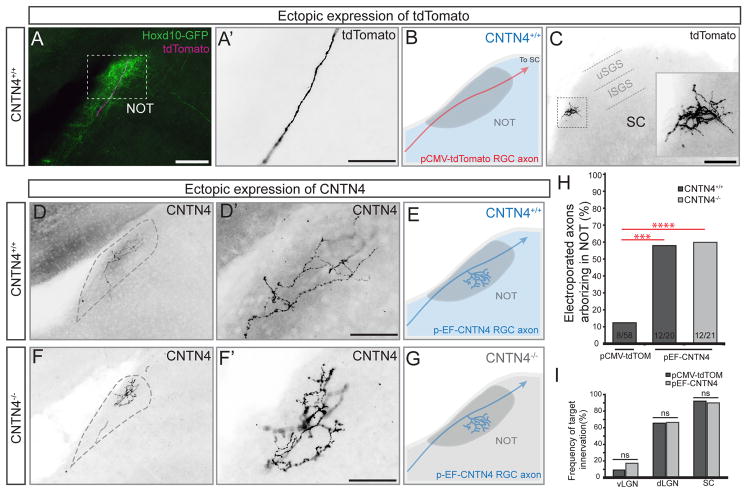
Figure 5. CNTN4 expression in RGC axons is sufficient to bias arborization in the NOT.
(A–F) Electroporation of RGCs with control/pCMV-tdTomato plasmid (A–C) or CNTN4 plasmid (D–G).
(A) Td-tomato+ axon (magenta) projecting through the NOT in a Hoxd10-GFP mouse (green). Scale = 250μm.
(A′) High magnification of tdTomato+ RGC axons from the boxed region in (A). Scale = 125μm.
(B) Schematic of typical outcome of td-Tomato expression (red) in RGCs of wildtype mice (wildtype denoted by blue color). (C) Axon terminal in the SC; this the same axon as shown in (A, A′). Inset: high magnification of boxed region in (C), Scale = 250μm. lSGS: lower stratum griseum superficialis. uSGS: upper stratum griseum superficialis.
(D–E) Example RGC axon electroporated with pEF-CNTN4 plasmid in wildtype background. (D′) High magnification of axon in (D); (E) Schematic of typical outcome of electroporation of CNTN4 in RGCs in a wildtype background.
(F–G) Example RGC axon electroporated with pEF-CNTN4 in a CNTN4−/− mouse. (F′) High magnification of axon in (F). (G) Schematic of typical outcome of electroporating CNTN4 into RGCs of CNTN4−/− mice. Scales in D′ and F′ = 125μm.
(H) Percentage of electroporated RGC axons arborizing in the NOT after electroporation of tdTomato or CNTN4. Statistical significance determined by Fisher analysis; ** = p<0.01; the fraction of electroporated RGCs for each experiment given at the bottom of the bars.
(I) Percentage of electroporated axons arborizing in other major retinorecipient targets after electroporation of tdTomato or CNTN4. Statistical significance calculated using Fisher analysis.

