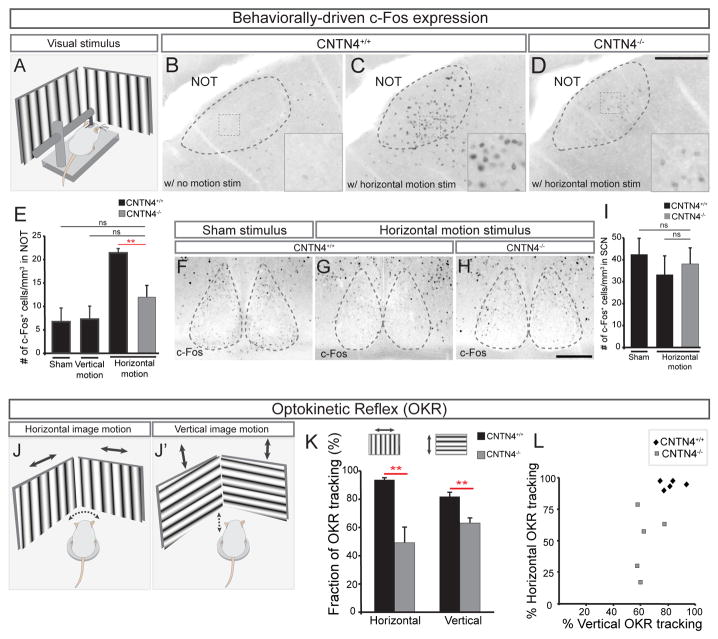
Figure 8. Loss of CNTN4 perturbs function and behavioral output of AOS circuitry.
(A) Schematic of visual stimulation. Head-fixed mouse is placed in a chamber surrounded by video monitors on all 4 sides.
(B–E) Analysis of c-Fos expression in NOT cells to assess the level of activity induced by a visual stimulus in wildtype (B, C) or CNTN4−/− mice (D). Insets in (B–D) high magnification views of boxed regions. Scale = 250μm. (E) Number of c-Fos+ cells in the NOT per mm3. ±SEM. *** = p<0.001 (n = 5–6 mice per group; age = P22–P23).
(F–I) c-Fos activation in the suprachiasmatic nucleus (SCN) of wildtype (F, G) or CNTN4−/− (H) mice. Scale = 100μm. (H) Number of c-Fos+ cells per mm3 of the SCN (±SEM); ns: no significant difference.
(J–L) Schematic if the optokinetic reflex (OKR) behavioral analysis; head movements in response to horizontal (J) or vertical drifting stimuli (J′) measured (see text and Experimental Procedures).
(K) The average percentage of trials tracked by CNTN4+/+ or CNTN4−/− mice in response to horizontal or vertical motion (n=5 mice per genotype).
(L) Plot of percentage of trials tracked in vertical versus horizontal motion for each animal.

