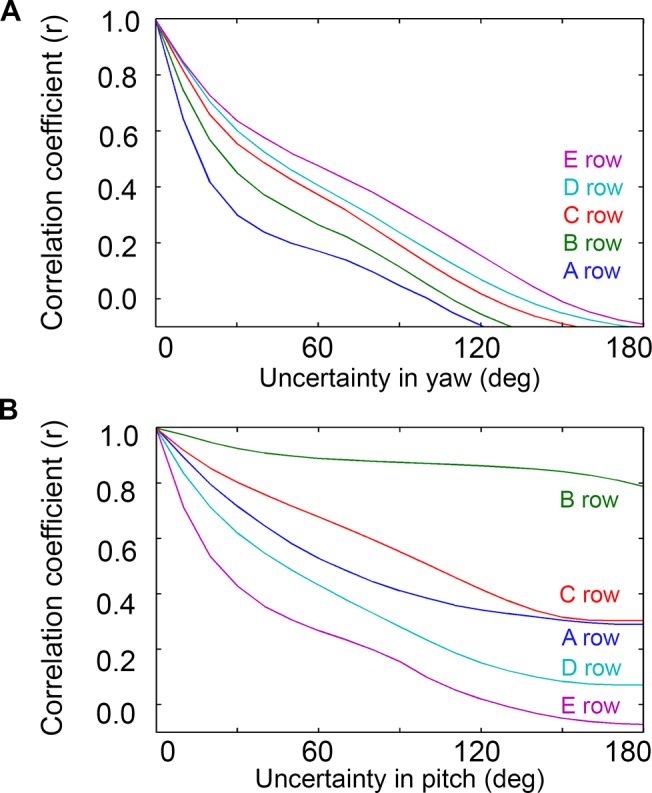
Fig 10. Correlation between θimpact and distance as a function of uncertainty in yaw and pitch.

Both analyses include whisking contacts only. A. For all rows, the correlation between θimpact and distance falls off rapidly as the uncertainty in yaw increases. The value of 0° on the x-axis corresponds to the yaw being known exactly, 180° corresponds to the yaw being allowed to take on any value. Pitch is held at a constant value of 0°. B. The correlation between θimpact and distance falls off differently for each row as uncertainty in pitch increases. The B and C rows show a greater robustness to uncertainty in pitch than do the exterior (A, D, and E) rows. The value of 0° on the x-axis corresponds to the pitch being known exactly, 180° corresponds to the pitch being allowed to take on any value. Yaw is held at a constant value of 0°.
