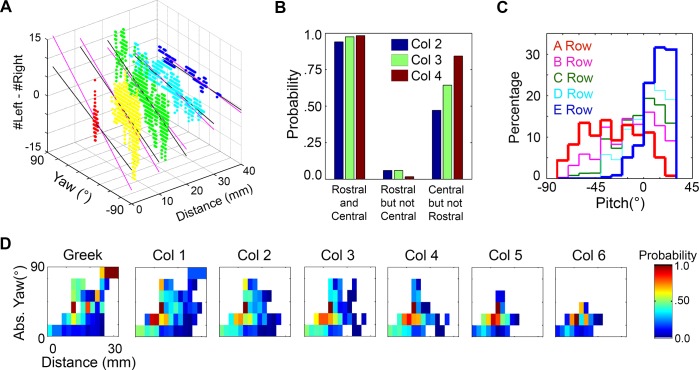
Fig 14. Behavioral data validate many predictions of the simulation.
A. Behavioral data replicate the result of Fig 6B. The difference in the number of contacts between the left and right arrays provides information about yaw. Each data point corresponds to one msec in the behavioral data, and the data points have been color-coded by distance for visual clarity. The black lines are fit to the behavioral data and the magenta lines correspond to the predicted slope from Fig 6B (averaged across pitches). B. If a rostral vibrissa (Col 5, 6) is in contact with the surface, vibrissae of the central columns (Col 2, 3, 4) are almost guaranteed to be in contact. Similarly, if a rostral vibrissa in contact, it is rare that there is no contact by a central column vibrissa. Conversely, if a central vibrissa is in contact, the probability a rostral vibrissa being in contact is more moderate. C. Contact by vibrissae of the exterior rows (row A, D, E) provides information about pitch. The A row is more likely to be in contact for negative pitch values while the D and E row are more likely to be in contact for positive pitch values. The interior B and C rows show distributions intermediate between those of the A and E rows. D. The Greek vibrissae are able to contact the wall for large yaws and at large distances. The color of each box corresponds to the number of msec in which contact was observed for a given configuration divided by the total number of msec the rat spent in that configuration.

