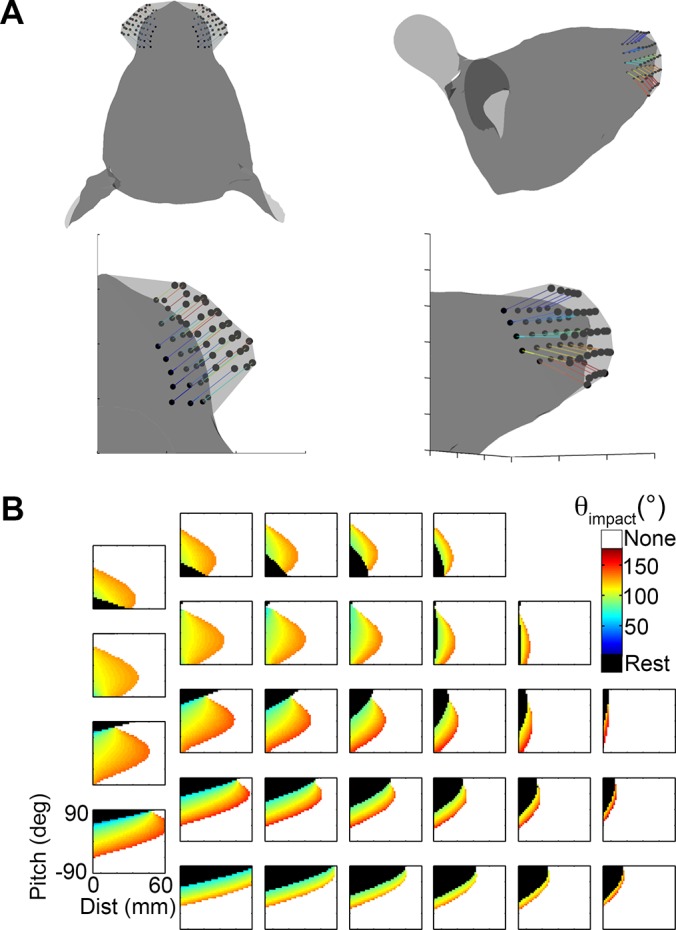
Fig 16. Effects of 3D basepoint translation.

A. Vibrissal basepoints were translated by the amounts shown in Table 5 over the course of the protraction values shown in column 6 of Table 4. (Left) The translations of the basepoints are shown in a top-down view. (Right) The translations of the basepoints are shown in a side-on view. B. Basepoint translations have some small effects on the details of the mappings (compare with Fig 15C) but do not alter the functional groupings.
