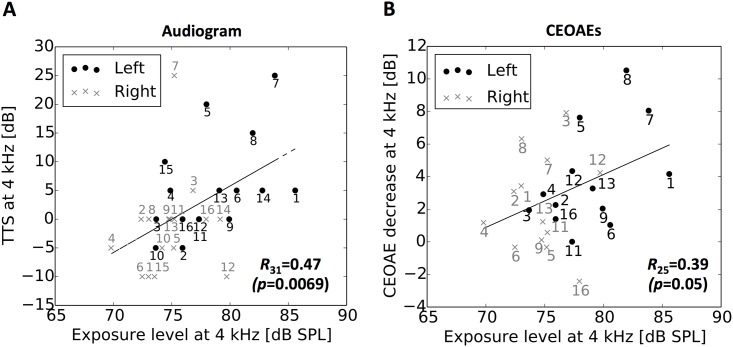
Fig 3. Amount of hearing deterioration reflects exposure level.
Correlation of exposure level at 4 kHz with the elevation of hearing threshold at 4 kHz (A) and with CEOAE decrease at 4 kHz (B). The data for the left and right ears are represented by the dots and crosses, respectively. The numbers attached to the symbols are participant numbers. The Pearson correlation coefficients, R, with their p-values shown in the panels, and the regression lines were derived for the pooled data for both ears.

