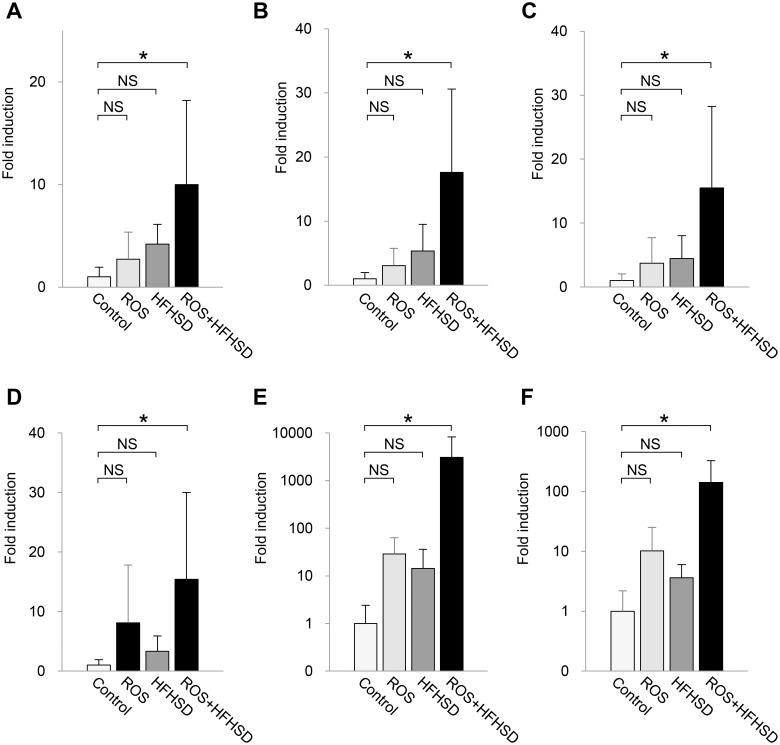
Fig 8. CC chemokine expression in liver tissues from mice fed normal chow or high-fat/high-sucrose diet.
Total RNA was extracted from liver tissues of male wild type or Tet-mev-1 mice (+ROS) that had been supplied with doxycycline-containing water and were subsequently fed a control, normal diet or high-fat/high-sucrose diet (+HFHSD) for 4 months at around the age of either 1 (left) or 2 years (right). The gene expression levels of CCL2 (A), CCL3 (B), CCL4 (C), CCL5 (D), CCL8 (E) and CCL12 (F) were quantified using specific primers. The values are expressed as means ± SD from four to five mice per group. The asterisks indicate that the differences between the groups are statistically significant (*p < 0.05). NS, not significant.

