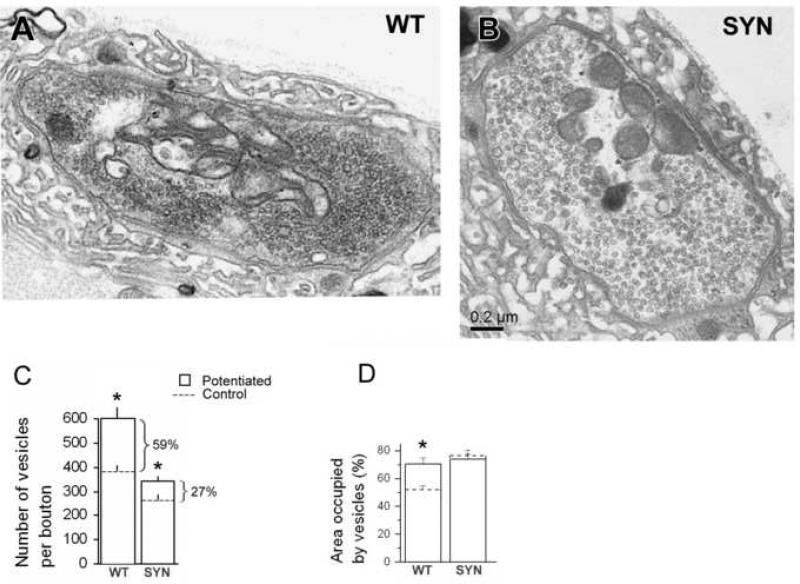
Figure 4. Synapsin promotes activity-dependent vesicle formation.
A,B. Representative micrographs showing WT (A) and synapsin (−) boutons (B) fixed after employing the potentiation paradigm (15 min at 10 Hz + 10 min rest). Note that in both genotypes vesicles are dispersed largely over entire boutons.
C. Vesicle numbers significantly increased upon potentiation in both genotypes, but in WT this increase is more prominent. Asterisks indicate significant (p<0.05) difference between resting (control) and potentiated states.
D. Area occupied by vesicles increased upon potentiation in WT but not in synapsin (−) (SYN) boutons. Asterisk indicates significant (p<0.05) difference between resting (control) and potentiated states. Data collected from 3 preparations (17-20 boutons) for each line at each condition.

